This classic Brook Haven ranch offers tons of potential! Gas heat (2018), central air, large screen porch, attached garage, and hardwood floors throughout give you a solid foundation on which to make updates. One-car attached garage, full basement with some finished space, and a level corner lot mean there is plenty of room for hobbies, yard games, or rainy day activities. You'll love living in super-convenient South Yarmouth with shopping, Smuggler's Beach, mini golf, marinas, and other attactions all less than 2 miles away. Welcome home!
For sale
$515,000
50 Shallow Brook Road, South Yarmouth, MA 02664
2beds
888sqft
Single Family Residence
Built in 1969
0.3 Acres Lot
$500,100 Zestimate®
$580/sqft
$-- HOA
What's special
Central airAttached garageLarge screen porchLevel corner lotHardwood floors throughout
- 8 days
- 600
- 48
Zillow last checked:
Listing updated:
Listed by:
Ned B Chatelain 508-776-4725,
Chatelain Real Estate
Source: CCIMLS,MLS#: 22605359
Facts & features
Interior
Bedrooms & bathrooms
- Bedrooms: 2
- Bathrooms: 1
- Full bathrooms: 1
Heating
- Natural Gas
Cooling
- Central Air
Appliances
- Included: Natural Gas, Water Heater
Features
- Flooring: Hardwood, Vinyl, Tile, Carpet
- Basement: Full
Interior area
- Total structure area: 888
- Total interior livable area: 888 sqft
Property
Parking
- Total spaces: 2
- Parking features: Garage - Attached
- Attached garage spaces: 1
Features
- Stories: 1
Lot
- Size: 0.3 Acres
Details
- Parcel number: YARM M:58 B:150 L:
- Special conditions: None
Construction
Type & style
- Home type: SingleFamily
- Property subtype: Single Family Residence
Materials
- Vinyl Siding
- Roof: Asphalt
Condition
- Year built: 1969
Utilities & green energy
- Water: Public
Community & HOA
Location
- Region: South Yarmouth
Financial & listing details
- Price per square foot: $580/sqft
- Tax assessed value: $512,200
- Annual tax amount: $3,570
- Date on market: 10/21/2026
- Cumulative days on market: 8 days
Estimated market value
$500,100
$475,000 - $525,000
$2,235/mo
Price history
| Date | Event | Price |
|---|---|---|
| 10/21/2026 | Listed for sale | $515,000$580/sqft |
Source:  CCIMLS #22605359 Report a problem | ||
Public tax history
| Year | Property taxes | Tax assessment |
|---|---|---|
| 2025 | $3,413 +7.7% | $482,100 +12.2% |
| 2024 | $3,170 +3.5% | $429,500 +13.7% |
| 2023 | $3,063 +12.4% | $377,700 +32.6% |
| 2022 | $2,724 | $284,900 |
| 2021 | $2,724 +2.1% | $284,900 +6.8% |
| 2020 | $2,668 +7.8% | $266,800 +8.9% |
| 2019 | $2,476 +5.8% | $245,100 +7.8% |
| 2018 | $2,340 +4.8% | $227,400 +2% |
| 2017 | $2,233 +4.5% | $222,900 +4.1% |
| 2016 | $2,137 -1.7% | $214,100 -1.1% |
| 2015 | $2,173 +3% | $216,400 +4.5% |
| 2014 | $2,110 +2.3% | $207,100 -0.8% |
| 2013 | $2,063 -1.2% | $208,800 -6.7% |
| 2012 | $2,089 +3.8% | $223,900 -3.9% |
| 2011 | $2,012 +6.9% | $232,900 -4.5% |
| 2010 | $1,882 +4% | $243,800 -9.3% |
| 2009 | $1,809 +2.1% | $268,800 -5.4% |
| 2008 | $1,771 +0.3% | $284,200 -5.1% |
| 2007 | $1,765 +8% | $299,600 +8.7% |
| 2006 | $1,635 +2.2% | $275,700 +17.9% |
| 2005 | $1,600 -35.3% | $233,900 +4.8% |
| 2004 | $2,472 | $223,100 |
| 2003 | $2,472 +95.6% | $223,100 +89.9% |
| 2001 | $1,264 | $117,500 |
Find assessor info on the county website
Monthly payment
Est. payment
Payment breakdown
Explore the cost of this home by adjusting the details. Changes won't be saved.Climate risks
Neighborhood: South Yarmouth
- $516,5002 bd2 ba1.1k sqft56 Shallow Brook Rd, South Yarmouth, MA 02664Off Market
- $495,9002 bd1 ba1k sqft20 Dancing Brook Rd, South Yarmouth, MA 02664Off Market

- $558,3002 bd1 ba888 sqft7 Fresh Brook Rd, South Yarmouth, MA 02664Off Market
- $473,2002 bd1 ba768 sqft49 Shallow Brook Rd, South Yarmouth, MA 02664Off Market
Similar homes
- $587,0002 bd1 ba1.1k sqft40 Captain Stanley Road, South Yarmouth, MA 02664For Sale
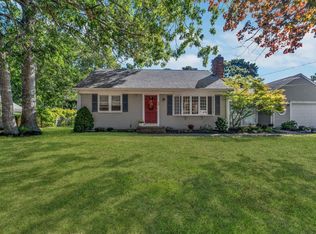
 MLS ID #22604521, Michelle A Ryan, Today Real Estate. CCIMLS
- $679,0002 bd2 ba1.1k sqft7 Spinning Brook Road, South Yarmouth, MA 02664For Sale
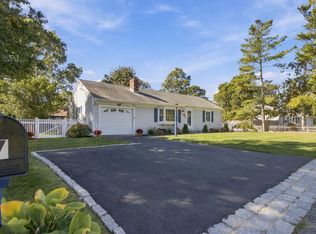 MLS ID #22605311, Galya Mihaylova - Assaker, Today Real Estate. CCIMLS
- $525,0003 bd1 ba840 sqft43 Evergreen Street, South Yarmouth, MA 02664For Sale
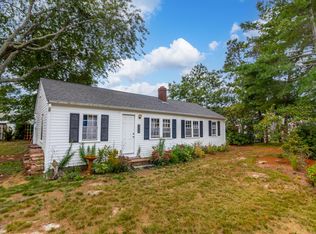 MLS ID #22604569, Beth Opishinski, LPT Realty. CCIMLS
- $560,0002 bd1 ba976 sqft20 Green Way, South Yarmouth, MA 02664For Sale
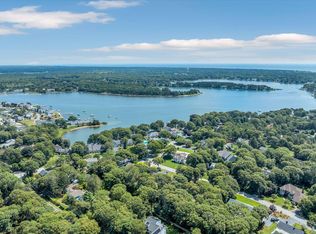 MLS ID #22604417, Cape Cod Power of Two, Compass. CCIMLS
- $585,0003 bd1 ba1k sqft67 Diane Avenue, South Yarmouth, MA 02664For SaleMLS ID #22605064, Sandra LaCasse, Jack Conway & Co Inc. CCIMLS
- $535,0002 bd1 ba974 sqft142 Winslow Gray Road, West Yarmouth, MA 02673For SaleMLS ID #22605099, Michelle Chaisson-Turmelle, Today Real Estate. CCIMLS
- $549,0002 bd2 ba1.2k sqft38 McNamara Avenue, West Yarmouth, MA 02673For SaleMLS ID #22603866, Christa Zevitas, Berkshire Hathaway HomeServices Robert Paul Properties. CCIMLS
- $679,0003 bd3 ba1.1k sqft38 Captain Small Road, South Yarmouth, MA 02664For SaleMLS ID #22605280, Tori Harrison Farr, Sotheby's International Realty, Inc.. CCIMLS
- $499,0003 bd2 ba1k sqft47 Acres Avenue, West Yarmouth, MA 02673For SaleMLS ID #22603718, Michele L Billingsley, LPT Realty. CCIMLS
- $549,0002 bd1 ba1k sqft11 Gate Way Street, South Yarmouth, MA 02664For SaleMLS ID #22603486, Scott Zaino Group, Keller Williams Realty. CCIMLS
- $625,0003 bd2 ba900 sqft46 Pawkannawkut Drive, South Yarmouth, MA 02664For SaleMLS ID #22603054, Sandra Milano, RE/MAX Executive Realty. CCIMLS
- $465,0002 bd3 ba1.2k sqft300 Buck Island Road #4A, West Yarmouth, MA 02673For SaleMLS ID #22604658, Karen D Lilly, Property Cape Cod. CCIMLS
- $545,0002 bd1 ba1.1k sqft28 Hoover Road, West Yarmouth, MA 02673For SaleMLS ID #22603131, Andrea A Desouza, By the C Realty and Property Management. CCIMLS
- $525,0003 bd2 ba1.2k sqft174 S Yarmouth Road, Dennis, MA 02638For SaleMLS ID #22605350, The Cape House Team, William Raveis Real Estate & Home Services. CCIMLS
- $509,9003 bd1 ba992 sqft25 Freydis Drive, South Dennis, MA 02660For SaleMLS ID #22604629, Richard J Waystack, Keller Williams Realty. CCIMLS
- $414,0002 bd1 ba680 sqft12 Lake Road E, West Yarmouth, MA 02673For SaleMLS ID #22604687, Tara Bazarewsky, Jack Conway. CCIMLS
- $545,0003 bd1 ba1k sqft222 Mayfair Road, South Dennis, MA 02660For SaleMLS ID #22604527, Karen St. Amand, Today Real Estate. CCIMLS
