?? FOR SALE – MIDLAND, TX
?? 501 W. Scharbauer Dr., Unit 8 | Midland, TX
?? Asking Price: $75,000
Affordable Homeownership or Investment Opportunity!
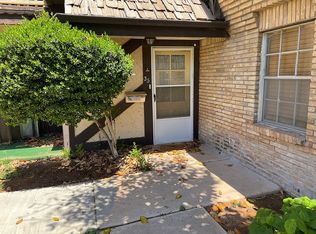
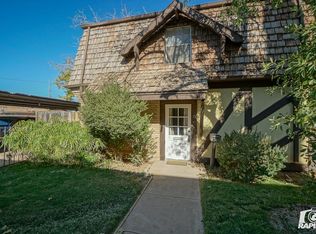
Looking for an affordable property in Midland with plenty of potential? This condominium offers a great opportunity for first-time buyers, investors, or anyone looking to create a space of their own.
Located in an established Midland neighborhood, this property offers the convenience of city living without the hefty price tag.
? Property Highlights:
* Affordable $75,000 asking price
* Established Midland location
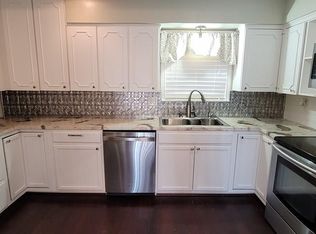
* Great opportunity for investors or buyers looking for a renovation project
* Potential for a personal residence or rental investment
* Located within the Scharbauer Townhome Association
* Property being sold AS-IS
Whether you’re looking to invest, renovate, or purchase an affordable home, this property offers an opportunity to make it your own.
Serious inquiries welcome! Private showings available by appointment.
?? Message me directly for additional information, photos, or to schedule a walkthrough.
Offered at $75,000
For sale by owner
$75,000
501 W Scharbauer Dr APT 8, Midland, TX 79705
2beds
996sqft
Condo
Built in 1963
-- sqft lot
$-- Zestimate®
$75/sqft
$420/mo HOA
Overview
What the owner loves about this home
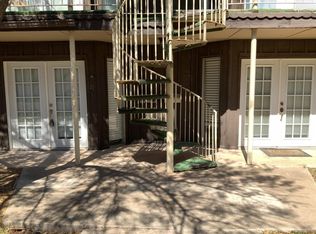
It is quite and overlooks a beautiful pool
- 1 day
- 65
- 2
Listed by:
Property Owner (432) 889-3493
Facts & features
Interior
Bedrooms & bathrooms
- Bedrooms: 2
- Bathrooms: 1
- Full bathrooms: 1
Features
- Has fireplace: No
Interior area
- Total interior livable area: 996 sqft
Property
Parking
- Parking features: Carport
Details
- Parcel number: 000819500000080
Construction
Type & style
- Home type: Condo
Condition
- New construction: No
- Year built: 1963
Community & HOA
HOA
- Has HOA: Yes
- HOA fee: $420 monthly
Location
- Region: Midland
Financial & listing details
- Price per square foot: $75/sqft
- Tax assessed value: $119,580
- Annual tax amount: $1,754
- Date on market: 11/5/2026
Estimated market value
Not available
Estimated sales range
Not available
$1,431/mo
Price history
| Date | Event | Price |
|---|---|---|
| 11/5/2026 | Listed for sale | $75,000-24.6%$75/sqft |
Source: Owner Report a problem | ||
| 8/17/2026 | Listing removed | $99,500$100/sqft |
Source:  PBBR #50091181 Report a problem | ||
| 4/16/2026 | Price change | $99,500-9.5%$100/sqft |
Source: PBBR #50091181 Report a problem | ||
| 2/27/2026 | Listed for sale | $110,000+29.4%$110/sqft |
Source: PBBR #50091181 Report a problem | ||
| 3/12/2024 | Listing removed | -- |
Source: PBBR #50060653 Report a problem | ||
| 3/4/2024 | Contingent | $85,000$85/sqft |
Source: PBBR #50060653 Report a problem | ||
| 8/5/2023 | Listed for sale | $85,000$85/sqft |
Source: PBBR #50060653 Report a problem | ||
| 8/2/2023 | Listing removed | -- |
Source: PBBR #50058012 Report a problem | ||
| 4/17/2023 | Listed for sale | $85,000-5.6%$85/sqft |
Source: PBBR #50058012 Report a problem | ||
| 4/13/2023 | Listing removed | -- |
Source: PBBR #50053708 Report a problem | ||
| 3/5/2023 | Price change | $90,000-5.3%$90/sqft |
Source: PBBR #50053708 Report a problem | ||
| 11/29/2022 | Price change | $95,000-5%$95/sqft |
Source: PBBR #50053708 Report a problem | ||
| 11/7/2022 | Price change | $100,000-4.8%$100/sqft |
Source: PBBR #50053708 Report a problem | ||
| 10/18/2022 | Price change | $105,000-4.5%$105/sqft |
Source: PBBR #50053708 Report a problem | ||
| 9/15/2022 | Listed for sale | $110,000+10%$110/sqft |
Source: PBBR #50053708 Report a problem | ||
| 9/7/2021 | Listing removed | -- |
Source: PBBR #50039720 Report a problem | ||
| 7/6/2021 | Contingent | $100,000-4.8%$100/sqft |
Source: PBBR #50039720 Report a problem | ||
| 6/9/2021 | Listed for sale | $105,000+5%$105/sqft |
Source: PBBR #50039720 Report a problem | ||
| 6/7/2021 | Listing removed | -- |
Source: PBBR #50038415 Report a problem | ||
| 4/23/2021 | Contingent | $100,000$100/sqft |
Source: PBBR #50038415 Report a problem | ||
| 4/20/2021 | Listed for sale | $100,000+17.6%$100/sqft |
Source: PBBR #50038415 Report a problem | ||
| 5/7/2017 | Listing removed | $85,000$85/sqft |
Source: Midland #50005505 Report a problem | ||
| 5/6/2017 | Pending sale | $85,000$85/sqft |
Source: Midland #50005505 Report a problem | ||
| 5/4/2017 | Listed for sale | $85,000$85/sqft |
Source: Midland #50005505 Report a problem | ||
| 4/28/2017 | Sold | -- |
Source: Agent Provided Report a problem | ||
Public tax history
| Year | Property taxes | Tax assessment |
|---|---|---|
| 2025 | $1,754 -5.5% | $119,580 -2.1% |
| 2024 | $1,855 +2% | $122,170 +0.6% |
| 2023 | $1,820 +27.1% | $121,420 +8.4% |
| 2022 | $1,432 +15.1% | $112,060 -0.1% |
| 2021 | $1,243 | $112,200 +19.4% |
| 2020 | $1,243 -23.6% | $93,950 |
| 2019 | $1,628 | $93,950 +2.6% |
| 2018 | $1,628 | $91,530 -3% |
| 2017 | -- | $94,400 +7.9% |
| 2016 | -- | $87,500 |
| 2015 | -- | $87,500 +24.2% |
| 2014 | -- | $70,430 +5.9% |
| 2013 | -- | $66,520 +20% |
| 2012 | -- | $55,440 +76.9% |
| 2011 | -- | $31,340 +0.2% |
| 2010 | -- | $31,290 |
| 2009 | -- | $31,290 -0.8% |
| 2008 | -- | $31,530 +13% |
| 2007 | -- | $27,900 +53.9% |
| 2006 | $482 | $18,130 |
| 2005 | -- | $18,130 |
| 2004 | -- | $18,130 |
Find assessor info on the county website
Monthly payment
Est. payment
Payment breakdown
Explore the cost of this home by adjusting the details. Changes won't be saved.Climate risks
Neighborhood: 79705
Similar homes
- $79,9001 bd1 ba987 sqft501 W Scharbauer Dr APT 27, Midland, TX 79705For Sale
 MLS ID #50098915, Bill Anderson, The Anderson Team Realtors, 432-272-4275. PBBR
- $75,0003 bd1 ba1.3k sqft510 N Fort Worth St, Midland, TX 79701For Sale
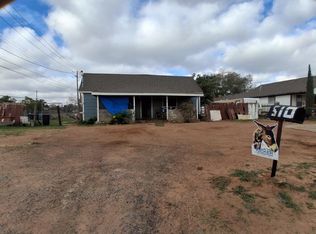 MLS ID #50099367, Joe Dale Iley, Mission Real Estate Group, 210-690-0050. PBBR
- $69,9001 bd1 ba987 sqft501 W Scharbauer Dr APT 12, Midland, TX 79705For Sale
 MLS ID #50090513, Kaily Richardson, The Real Estate Company, 432-618-0286. PBBR
- $87,5002 bd2 ba960 sqft3000 W Illinois Ave APT 24, Midland, TX 79701For Sale
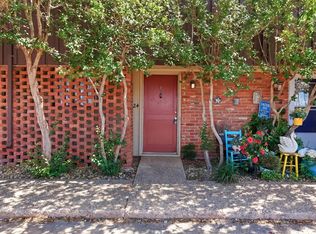 MLS ID #50094422, Laura Lyons Sales, The Sales Team Realtors, 432-618-1818. PBBR
