Skip main navigation
Off market
  • $738,800

    5038 N Harding Ave, Chicago, IL 60625

    5beds
    3baths
    3,150sqft
    SingleFamily
    Built in 1955
    3,968 Square Feet Lot
    $738,800 Zestimate®
    $235/sqft
    $4,781 Estimated rent

    Home value

    $738,800

    $665,000 - $820,000

    $4,781/mo

    Zestimate® history
    Loading
    Loading...

    Owner options

    List your home for rent

    $4,781/mo

    Rent Zestimate®

    Find your next renter with Zillow Rental Manager. Plus, with online applications, you can quickly screen prospective tenants – for free.

    Learn more

    $4,781/mo

    Rent Zestimate®

    Refinance and save

    $5,171/mo

    Est. payment

    Refinancing to a lower rate could help reduce your monthly payments and save thousands over the life of the loan.

    See today's rates

    $5,171/mo

    Est. payment

    Explore your selling options

    Work with a Zillow partner agent

    Leverage their expertise and Zillow's premium Showcase listings to get your home seen by more buyers.

    Get started

    List with your own agent

    Get your home in front of millions of buyers by listing it on Zillow.

    Learn how to do it

    Sell it yourself

    Take full control of how buyers see your home on Zillow by listing For Sale by Owner (FSBO).

    List your home

    What's special

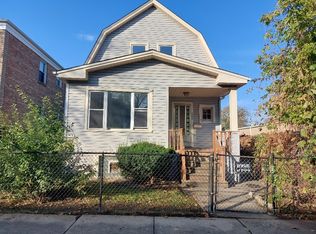
    This 3150 square foot single family home has 5 bedrooms and 3.0 bathrooms. This home is located at 5038 N Harding Ave, Chicago, IL 60625.

    This property is off market, which means it's not currently listed for sale or rent on Zillow. This may be different from what's available on other websites or public sources.

    Facts & features

    Interior

    Bedrooms & bathrooms
    • Bedrooms: 5
    • Bathrooms: 3
    Heating
    • Forced air
    Cooling
    • None
    Interior area
    • Total interior livable area: 3,150 sqft

    Property

    Lot
    • Size: 3,968 sqft
    Details
    • Parcel number: 1311305017

    Construction

    Type & style
    • Home type: SingleFamily
    Materials
    • Frame
    • Roof: Shake / Shingle
    Condition
    • Year built: 1955

    Community & neighborhood

    Location
    • Region: Chicago

    Price history

    DateEventPrice
    11/6/2025Listing removed$674,900$214/sqft
    Source: MRED as distributed by MLS GRID #12485586 Report a problem
    10/23/2025Price change$674,900-0.7%$214/sqft
    Source: MRED as distributed by MLS GRID #12485586 Report a problem
    10/1/2025Price change$679,900-2.9%$216/sqft
    Source: MRED as distributed by MLS GRID #12485586 Report a problem
    9/18/2025Listed for sale$699,900-2.8%$222/sqft
    Source: MRED as distributed by MLS GRID #12475243 Report a problem
    9/18/2025Listing removed$719,900$229/sqft
    Source: MRED as distributed by MLS GRID #12450322 Report a problem
    8/20/2025Listed for sale$719,900+94.6%$229/sqft
    Source: MRED as distributed by MLS GRID #12450322 Report a problem
    10/28/2022Sold$370,000-7.3%$117/sqft
    Source: MRED as distributed by MLS GRID #11661987 Report a problem
    10/27/2022Contingent$399,000$127/sqft
    Source: MRED as distributed by MLS GRID #11661987 Report a problem
    10/27/2022Listed for sale$399,000-13.1%$127/sqft
    Source: MRED as distributed by MLS GRID #11661987 Report a problem
    7/13/2022Listing removed--
    Source: MRED as distributed by MLS GRID #11055905 Report a problem
    10/19/2021Contingent$459,000$146/sqft
    Source: MRED as distributed by MLS GRID #11055905 Report a problem
    10/14/2021Listed for sale$459,000+108.6%$146/sqft
    Source: MRED as distributed by MLS GRID #11055905 Report a problem
    6/17/1999Sold$220,000$70/sqft
    Source: Public Record Report a problem

    Public tax history

    YearProperty taxesTax assessment
    2024-- $51,000 +13.3%
    2023$9,528 +2.6%$44,999
    2022$9,288 +2.3%$44,999
    2021$9,079 +18.1%$44,999 +30.8%
    2020$7,688 -3.5%$34,392 -13%
    2019$7,969 +1.7%$39,531
    2018$7,834 -4.7%$39,531 +3.9%
    2017$8,216 +7.5%$38,042
    2016$7,645 +9.3%$38,042
    2015$6,995 +3.8%$38,042 -1.8%
    2014$6,737 +2.2%$38,747
    2013$6,593 +1.3%$38,747
    2012$6,505 +0.6%$38,747 -7.6%
    2011$6,466 -0.9%$41,919
    2010$6,525 +4.3%$41,919
    2009$6,259 -0.1%$41,919 -7.9%
    2008$6,264 +21.3%$45,516
    2007$5,166 +5.3%$45,516 -7%
    2006$4,907 +6%$48,958 +37.3%
    2005$4,628 +2.6%$35,646
    2004$4,510 +3.6%$35,646
    2003$4,354 +14.8%$35,646 +55.4%
    2002$3,793 +4.7%$22,933
    2001$3,621 +9.9%$22,933
    2000$3,296 -0.7%$22,933 +33.7%
    1999$3,318 $17,155

    Find assessor info on the county website

    Neighborhood: Albany Park

    Nearby schools

    GreatSchools rating
    Get a cash offer in 3 minutes
    Find out how much your home could sell for in as little as 3 minutes with a no-obligation cash offer.
    Estimated market value
    $738,800
    Get a cash offer in 3 minutes
    Find out how much your home could sell for in as little as 3 minutes with a no-obligation cash offer.
    Estimated market value
    $738,800