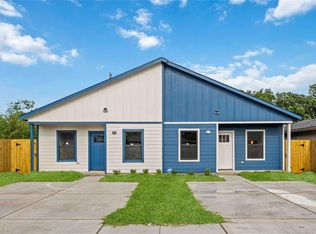
$437,000
6 bd|4 ba|2.5k sqft
5211 Amy St, Houston, TX 77028
Off Market
Likely to sell faster than
Zillow last checked:
Listing updated:
Jose Luis Gonzalez TREC #0829620 832-859-7078,
Champions NextGen Real Estate
Not available
Estimated sales range
Not available
$1,926/mo
| Date | Event | Price |
|---|---|---|
| 4/28/2026 | Listed for sale | $70,000+16.7% |
Source: | ||
| 10/14/2024 | Listing removed | $60,000 |
Source: | ||
| 10/14/2024 | Listed for sale | $60,000 |
Source: | ||
| 10/10/2024 | Pending sale | $60,000 |
Source: | ||
| 12/6/2023 | Listed for sale | $60,000+22.4% |
Source: | ||
| 2/22/2023 | Listing removed | -- |
Source: | ||
| 2/1/2023 | Pending sale | $49,000 |
Source: | ||
| 2/1/2023 | Listed for sale | $49,000+8.9% |
Source: | ||
| 10/12/2022 | Listing removed | -- |
Source: | ||
| 7/27/2022 | Listed for sale | $45,000-5.3% |
Source: | ||
| 10/20/2021 | Listing removed | -- |
Source: | ||
| 9/27/2021 | Pending sale | $47,500 |
Source: | ||
| 9/14/2021 | Listed for sale | $47,500 |
Source: | ||
| Year | Property taxes | Tax assessment |
|---|---|---|
| 2025 | $722 +21.9% | $36,996 +30.6% |
| 2024 | $593 +24.1% | $28,325 +19.5% |
| 2023 | $478 +17.2% | $23,701 +28.1% |
| 2022 | $407 | $18,498 +77.8% |
| 2021 | -- | $10,405 +50% |
| 2020 | -- | $6,937 +215.7% |
| 2019 | $53 -4.1% | $2,197 |
| 2018 | $56 | $2,197 |
| 2017 | $56 -60.4% | $2,197 -60.4% |
| 2016 | $140 -1.6% | $5,549 |
| 2015 | $143 | $5,549 |
| 2014 | $143 | $5,549 |
| 2013 | -- | $5,549 |
| 2012 | -- | $5,549 |
| 2011 | -- | $5,549 |
| 2010 | -- | $5,549 |
| 2009 | -- | $5,549 |
| 2008 | -- | $5,549 +9.1% |
| 2007 | -- | $5,087 -2.6% |
| 2006 | -- | $5,225 +100% |
| 2005 | -- | $2,612 |
Find assessor info on the county website
Source: HAR. This data may not be complete. We recommend contacting the local school district to confirm school assignments for this home.
A local agent can set up tours, give advice and negotiate with sellers.