Check out this cozy home in the heart of downtown Jeffersonville! ???
Enjoy the convenience of being within walking distance of some of the area’s best spots, including Spring Street, the Overlook, the walking bridge, and more. Perfectly situated for enjoying everything downtown Jeffersonville has to offer!
For sale by owner
$169,900
513 E Maple St, Jeffersonville, IN 47130
2beds
845sqft
SingleFamily
Built in 1901
4,284 Square Feet Lot
$-- Zestimate®
$201/sqft
$-- HOA
What's special
Cozy home
What the owner loves about this home
2 bedrooms plus a versatile bonus room—perfect for a home office, dressing room, or spacious walk-in closet!
1-car garage with convenient alley access.
- 44 days
- 352
- 27
Listed by:
Property Owner (502) 550-1503
Facts & features
Interior
Bedrooms & bathrooms
- Bedrooms: 2
- Bathrooms: 1
- Full bathrooms: 1
Heating
- Other
Appliances
- Included: Dryer, Freezer, Range / Oven, Refrigerator, Washer
Features
- Flooring: Carpet, Laminate, Linoleum / Vinyl
- Basement: None
Interior area
- Total interior livable area: 845 sqft
Property
Parking
- Parking features: Garage - Detached, On-street
Features
- Exterior features: Vinyl
- Has view: Yes
- View description: City
Lot
- Size: 4,284 Square Feet
Details
- Parcel number: 101900100731000010
Construction
Type & style
- Home type: SingleFamily
Materials
- Frame
- Foundation: Crawl/Raised
- Roof: Asphalt
Condition
- New construction: No
- Year built: 1901
Community & HOA
Location
- Region: Jeffersonville
Financial & listing details
- Price per square foot: $201/sqft
- Tax assessed value: $143,700
- Annual tax amount: $1,296
- Date on market: 10/3/2026
Estimated market value
Not available
Estimated sales range
Not available
$1,198/mo
Price history
| Date | Event | Price |
|---|---|---|
| 10/3/2026 | Listed for sale | $169,900$201/sqft |
Source: Owner Report a problem | ||
Public tax history
| Year | Property taxes | Tax assessment |
|---|---|---|
| 2025 | $1,296 +12.5% | $143,700 +10.9% |
| 2024 | $1,152 +13% | $129,600 +8% |
| 2023 | $1,020 +29.8% | $120,000 +10.6% |
| 2022 | $786 +20.2% | $108,500 +16% |
| 2021 | $654 +38% | $93,500 +9.6% |
| 2020 | $474 -3.7% | $85,300 +13% |
| 2019 | $492 +5.3% | $75,500 +5.9% |
| 2018 | $467 +4.5% | $71,300 +0.3% |
| 2017 | $447 | $71,100 +2% |
| 2016 | $447 +8.4% | $69,700 +1.3% |
| 2014 | $413 +7.2% | $68,800 +2.7% |
| 2013 | $385 +23.6% | $67,000 -1.2% |
| 2012 | $312 -10.6% | $67,800 -5.6% |
| 2011 | $349 +9.2% | $71,800 +2% |
| 2010 | $319 +14.4% | $70,400 |
| 2009 | $279 | $70,400 -7.2% |
| 2007 | -- | $75,900 |
| 2006 | -- | $75,900 |
Find assessor info on the county website
Monthly payment
Est. payment
Payment breakdown
Explore the cost of this home by adjusting the details. Changes won't be saved.Climate risks
Neighborhood: 47130

Similar homes
- $178,0002 bd1 ba985 sqft811 E Court Avenue, Jeffersonville, IN 47130For Sale
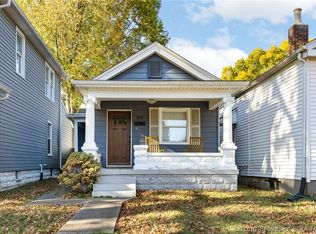 MLS ID #2026013295, Katy Spalding, Six Degrees Real Estate LLC. SIRA
- $169,0002 bd1 ba705 sqft406 W 14th Street, Jeffersonville, IN 47130For Sale
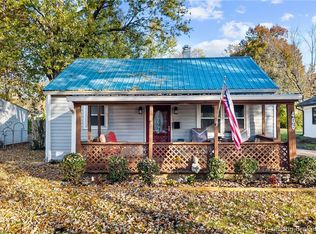 MLS ID #2026013372, Sara Carpenter, Schuler Bauer Real Estate Services ERA Powered (N. SIRA
- $169,9003 bd1 ba955 sqft319 E Charlestown Avenue, Jeffersonville, IN 47130For Sale
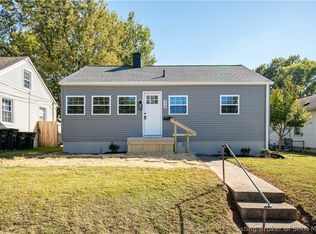 MLS ID #2026012736, Chris Koerner, Property Advancement Realty. SIRA
- $190,0003 bd1 ba925 sqft725 Goyne Drive, Jeffersonville, IN 47130For Sale
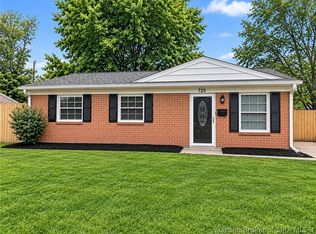 MLS ID #2026013127, Lisa K Williams, Schuler Bauer Real Estate Services ERA Powered (N. SIRA
- $164,5002 bd2 ba990 sqft908 Mechanic St, Jeffersonville, IN 47130For Sale
 MLS ID #1719476, Jay Pitts, RE/MAX Premier Properties. Metro Search Inc. LLC DBA Apex MLS
- $194,9003 bd1 ba981 sqft1037 Watt St, Jeffersonville, IN 47130For SaleMLS ID #1731247, Courtney McDonald, Lopp Residential LLC. Metro Search Inc. LLC DBA Apex MLS
- $175,0002 bd2 ba949 sqft125 N Jane St, Louisville, KY 40206For SaleMLS ID #1732226, Jessica Yu, Keller Williams Collective. Metro Search Inc. LLC DBA Apex MLS
