null Brokered And Advertised By: First Team Real Estate Listing Agent: Doug West
Pre-foreclosure
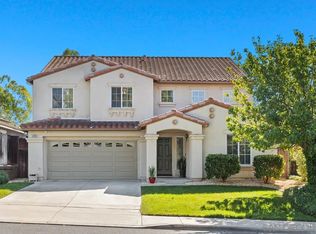
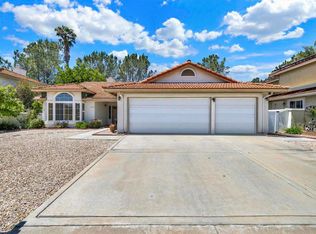
Street View
Est. $968,300
5137 Mendip St, Oceanside, CA 92057
4beds
3baths
2,394sqft
SingleFamily
Built in 2004
6,198 Square Feet Lot
$968,300 Zestimate®
$404/sqft
$97/mo HOA
Overview
- 70 days |
- 70 |
- 3 |
Facts & features
Interior
Bedrooms & bathrooms
- Bedrooms: 4
- Bathrooms: 3
Interior area
- Total interior livable area: 2,394 sqft
Property
Parking
- Total spaces: 2
Lot
- Size: 6,198 Square Feet
Details
- Parcel number: 1225101900
Construction
Type & style
- Home type: SingleFamily
Condition
- Year built: 2004
Community & HOA
HOA
- Has HOA: Yes
- HOA fee: $97 monthly
Location
- Region: Oceanside
Financial & listing details
- Price per square foot: $404/sqft
- Tax assessed value: $489,848
- Annual tax amount: $6,510
Visit our professional directory to find a foreclosure specialist in your area that can help with your home search.
Find a foreclosure agentForeclosure details
Estimated market value
$968,300
$920,000 - $1.02M
$4,741/mo
Price history
| Date | Event | Price |
|---|---|---|
| 5/30/2012 | Sold | $390,000-1.4%$163/sqft |
Source: Public Record Report a problem | ||
| 4/17/2012 | Listed for sale | $395,500-10.3%$165/sqft |
Source: First Team Real Estate #120019430 Report a problem | ||
| 12/23/2003 | Sold | $441,000$184/sqft |
Source: Public Record Report a problem | ||
Public tax history
| Year | Property taxes | Tax assessment |
|---|---|---|
| 2025 | $6,510 -1.3% | $489,848 +2% |
| 2024 | $6,599 +3% | $480,244 +2% |
| 2023 | $6,408 +1.3% | $470,828 +2% |
| 2022 | $6,326 -0.3% | $461,597 +2% |
| 2021 | $6,343 +2.6% | $452,547 +1% |
| 2020 | $6,182 +27.7% | $447,907 +2% |
| 2019 | $4,841 -19.1% | $439,126 +2% |
| 2018 | $5,981 -0.4% | $430,517 +2% |
| 2017 | $6,005 +2.1% | $422,077 +2% |
| 2016 | $5,881 +2.3% | $413,802 +1.5% |
| 2015 | $5,752 +2.3% | $407,587 +2% |
| 2014 | $5,622 | $399,604 +0.5% |
| 2013 | -- | $397,799 +13.3% |
| 2012 | -- | $351,000 |
| 2011 | -- | $351,000 |
| 2010 | -- | $351,000 -7.6% |
| 2009 | -- | $380,000 -20.4% |
| 2008 | -- | $477,166 +2% |
| 2007 | -- | $467,811 +2% |
| 2006 | -- | $458,640 +2% |
| 2005 | -- | $449,648 +2% |
| 2004 | -- | $440,832 |
Find assessor info on the county website
Monthly payment
Estimated monthly payment$1,822
All calculations are estimates and provided by Zillow, Inc. for informational purposes only. Actual amounts may vary.
HOA fees may include property taxes on listings classified as Co-Ops. Contact the listing agent and/or owner for fee details.
Mortgage interest rates are dependent on a number of factors, including credit score, down payment, and repayment length. Interest rate data provided by Zillow Group Marketplace, Inc. as of 1/1/1970 from various mortgage lenders with which we have lead or other similar arrangements; the Estimated Payment is an average of those rates.
See how much you could borrow to make a competitive offer.
Climate risks
Neighborhood: North Valley
Nearby schools
GreatSchools rating
- 6/10Del Rio Elementary SchoolGrades: K-5Distance: 1.2 mi
- 6/10Cesar Chavez Middle SchoolGrades: 6-8Distance: 2.1 mi
- 7/10El Camino High SchoolGrades: 9-12Distance: 4 mi


- California
- San Diego County
- Oceanside
- 92057
- North Valley
- 5137 Mendip St
Nearby cities
Nearby neighborhoods
Nearby zip codes
Other Oceanside Topics
