Prime Multifamily Lot – Desirable SE Cape Coral Location
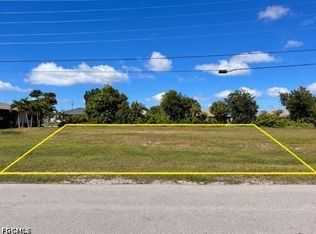
Excellent opportunity to build in one of Cape Coral’s most convenient and desirable areas! This triple multifamily lot (over 1/3 acre) offers the perfect setting for your next investment or development project.
Located just off Cultural Park Blvd, this property is minutes from City Hall, the Police and Fire Department, providing easy access to shopping, dining, and essential services. Quick routes to North Fort Myers and Downtown Fort Myers make this location ideal for commuters and renters alike.
Zoned for multifamily use, the lot is suitable for up to 6 apartment units, offering excellent income potential in a growing market.
Active
$164,500
519 SE 5th St, Cape Coral, FL 33990
--beds
--baths
0.34Acres
Unimproved Land
Built in ----
0.34 Acres Lot
$-- Zestimate®
$--/sqft
$-- HOA
What's special
- 362 days
- 11
- 0
Zillow last checked:
Listing updated:
Listed by:
Rene Alvarez 239-281-6763,
Innova Real Estate Corp
Source: Florida Gulf Coast MLS,MLS#: 2025019618 Originating MLS: Florida Gulf Coast
Facts & features
Property
Features
- Has view: Yes
- View description: Partial Buildings
- Waterfront features: None
Lot
- Size: 0.34 Acres
- Dimensions: 120 x 125 x 120 x 125
- Features: Multiple lots
Details
- Parcel number: 134423C301137.0820
- Lease amount: $0
- Zoning description: R3-D
Utilities & green energy
- Sewer: Assessment Paid, Public Sewer
- Water: Assessment Paid, Public
- Utilities for property: Cable Available, Electricity Available, Phone Available, Sewer Available, Trash Collection, Water Available
Community & HOA
Community
- Features: Non-Gated, None
- Condo and coop fee: $0
- Membership fee: $0
- Subdivision: CAPE CORAL
HOA
- Services included: None
Location
- Region: Cape Coral
Financial & listing details
- Tax assessed value: $86,080
- Annual tax amount: $3,269
- Date on market: 11/10/2025
- Cumulative days on market: 363 days
- Listing terms: All Financing Considered,Cash
- Electric utility on property: Yes
- Road surface type: Paved
Estimated market value
Not available
Estimated sales range
Not available
Not available
Price history
| Date | Event | Price |
|---|---|---|
| 11/10/2025 | Listed for sale | $164,500+188.6% |
Source:  Florida Gulf Coast MLS #2025019618 Report a problem | ||
| 2/28/2020 | Sold | $57,000-12.3% |
Source: Florida Gulf Coast MLS #220003988 Report a problem | ||
| 1/23/2020 | Pending sale | $65,000 |
Source: RE/MAX Trend #220003988 Report a problem | ||
| 8/27/2019 | Listed for sale | $65,000 |
Source: RE/MAX Trend #219044808 Report a problem | ||
| 7/22/2019 | Pending sale | $65,000 |
Source: RE/MAX Trend #219044808 Report a problem | ||
| 6/27/2019 | Listed for sale | $65,000 |
Source: RE/MAX Trend #219044808 Report a problem | ||
| 5/20/2019 | Listing removed | $65,000 |
Source: RE/MAX Trend #218033982 Report a problem | ||
| 4/17/2019 | Listed for sale | $65,000-18.6% |
Source: RE/MAX Trend #218033982 Report a problem | ||
| 5/18/2018 | Listed for sale | $79,900 |
Source: RE/MAX Trend #218033982 Report a problem | ||
| 2/22/2018 | Listing removed | $79,900 |
Source: Schooner Bay Realty, Inc. #217053546 Report a problem | ||
| 8/23/2017 | Listed for sale | $79,900+1231.7% |
Source: Schooner Bay Realty, Inc. #217053546 Report a problem | ||
| 1/10/2003 | Sold | $6,000 |
Source: Public Record Report a problem | ||
Public tax history
| Year | Property taxes | Tax assessment |
|---|---|---|
| 2025 | $3,139 -4% | $71,741 +10% |
| 2024 | $3,269 +10.5% | $65,219 +10% |
| 2023 | $2,959 +5.8% | $59,290 +10% |
| 2022 | $2,795 +5.5% | $53,900 +10% |
| 2021 | $2,651 +44.8% | $49,000 +374.4% |
| 2020 | $1,830 +1.5% | $10,328 -79.3% |
| 2019 | $1,803 | $50,000 +38.9% |
| 2018 | $1,803 +5.6% | $36,000 +58.1% |
| 2017 | $1,707 +6.6% | $22,772 +19.9% |
| 2016 | $1,601 +0.1% | $19,000 +5.6% |
| 2015 | $1,600 +2.6% | $18,000 +49.6% |
| 2014 | $1,560 +6.5% | $12,032 +127% |
| 2013 | $1,465 +7.1% | $5,300 -11.7% |
| 2012 | $1,367 -3.9% | $6,000 -40% |
| 2011 | $1,423 -0.2% | $10,000 +19% |
| 2010 | $1,426 -9.7% | $8,400 -47.8% |
| 2009 | $1,579 -5.9% | $16,100 -37.8% |
| 2008 | $1,679 -28.7% | $25,880 -59.1% |
| 2007 | $2,356 -39.1% | $63,250 -40.9% |
| 2006 | $3,866 +555.8% | $106,990 +328.6% |
| 2004 | $590 +73% | $24,960 +91.3% |
| 2003 | $341 +78% | $13,050 +105.5% |
| 2002 | $191 | $6,350 +25.5% |
| 2000 | -- | $5,060 |
Find assessor info on the county website
Monthly payment
Climate risks
Neighborhood: 33990
- $264,8004 bd2 ba945 sqft513 SE 5th St APT 1-2, Cape Coral, FL 33990Off Market
- $464,6006 bd6 ba1k sqft525 SE 5th St APT 1-3, Cape Coral, FL 33990Off Market
- $436,600-- bd2 ba1k sqft525 SE 5th St APT 3, Cape Coral, FL 33990Off Market
- $418,900-- bd2 ba1k sqft525 SE 5th St APT 2, Cape Coral, FL 33990Off Market
Similar homes
- $139,5000.34 acres724 SE 8th Pl, Cape Coral, FL 33990Lot/Land
 MLS ID #2026043076, Catherine Benitez, Realty One Group MVP. Florida Gulf Coast MLS
- $120,00010,018 sqft421 SE 10th Ave, Cape Coral, FL 33990Lot/Land
 MLS ID #2026020571, Kati Weiss, Best Invest Realty LLC. Florida Gulf Coast MLS
- $95,10010,018 sqft134 SE 7th St, Cape Coral, FL 33990Lot/Land
 MLS ID #2026040165, Maureen Ahmed, John R. Wood Properties. Florida Gulf Coast MLS
- $200,0000.41 acres118 Cultural Park Blvd S, Cape Coral, FL 33990Lot/Land
 MLS ID #2026039161, Yeimi Sanchez, Pelican Vista Realty. Florida Gulf Coast MLS
- $150,0000.36 acres158 HANCOCK BRIDGE Parkway, Cape Coral, FL 33990Lot/Land
 MLS ID #B26074849, Wendy Sanchez, Viventi Realty LLC. BeachesMLS
- $102,90010,018 sqft404 SE 9th Pl, Cape Coral, FL 33990Lot/LandMLS ID #2025008407, Faith Sirakis, Marzucco Real Estate. Florida Gulf Coast MLS
- $98,00010,018 sqft622 SE 1st St, Cape Coral, FL 33990Lot/LandMLS ID #2026025781, Jim Agles, Pelican's Nest Realty Services. Florida Gulf Coast MLS
- $129,9000.26 acres628 Nicholas Pkwy E, Cape Coral, FL 33990Lot/LandMLS ID #2026038646, Rob Mercora, Schiff Realty, Inc. Florida Gulf Coast MLS
- $139,90010,018 sqft1401 NE 2nd St, Cape Coral, FL 33909Lot/LandMLS ID #2026046334, Debbie Goodwin, Florida Premier Real Estate. Florida Gulf Coast MLS
- $169,00010,018 sqft1102 SE 13th Ave, Cape Coral, FL 33990Lot/LandMLS ID #2026028757, Ron Swiger, LoKation. Florida Gulf Coast MLS
- $109,0000.36 acres(Undisclosed Address), Cape Coral, FL 33990Lot/LandMLS ID #2026038661, Rowdy Adams, Realty One Group MVP. Florida Gulf Coast MLS
- $144,9000.28 acres1302 SE 8th Pl, Cape Coral, FL 33990Lot/LandMLS ID #2026004384, Miguel Rodriguez, East West Properties. Florida Gulf Coast MLS
- $93,00010,018 sqft711 SE 8th St, Cape Coral, FL 33990Lot/LandMLS ID #2026006133, Heidy Olea, Olea Group Real Estate & Construction, LLC. Florida Gulf Coast MLS
- $199,9990.38 acres214 SE 12th St, Cape Coral, FL 33990Lot/LandMLS ID #2026019876, Jim Agles, Pelican's Nest Realty Services. Florida Gulf Coast MLS
- $115,78510,018 sqft415 SE 16th St, Cape Coral, FL 33990Lot/LandMLS ID #2026027882, Mike Darda, Compass Florida LLC. Florida Gulf Coast MLS
- $139,90010,018 sqft428 SE 13th Ter, Cape Coral, FL 33990Lot/LandMLS ID #2026002568, Debbie Goodwin, Florida Premier Real Estate. Florida Gulf Coast MLS
- $150,0000.27 acres217 SE 21ST Street, Cape Coral, FL 33990Lot/LandMLS ID #B26070140, Wendy Sanchez, Viventi Realty LLC. BeachesMLS
- $99,00010,018 sqft505 SE 7th St, Cape Coral, FL 33990Lot/LandMLS ID #221080780, W. Dean Pulley, W Dean Pulley PA. Florida Gulf Coast MLS
- $139,90010,018 sqft612 SW 12th Ter, Cape Coral, FL 33991Lot/LandMLS ID #2026046344, Debbie Goodwin, Florida Premier Real Estate. Florida Gulf Coast MLS
