$242,100
4 bd|2 ba|1.8k sqft
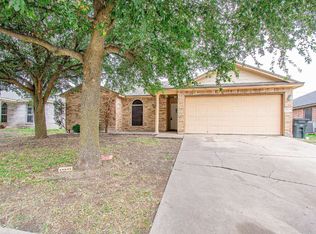
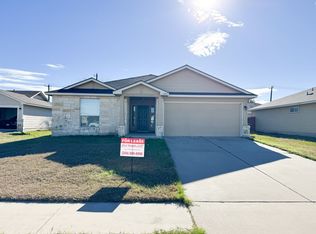
5202 Rimes Ct, Killeen, TX 76549
Off Market
Zillow last checked:
Listing updated:
Vernon MacHardy (254)200-3800,
Coldwell Banker Realty
$215,600
$205,000 - $226,000
$1,610/mo
| Date | Event | Price |
|---|---|---|
| 6/19/2026 | Listed for sale | $220,000$142/sqft |
Source: | ||
| 10/28/2024 | Listing removed | $1,650$1/sqft |
Source: Zillow Rentals Report a problem | ||
| 10/20/2024 | Price change | $1,650-2.7%$1/sqft |
Source: Zillow Rentals Report a problem | ||
| 7/15/2024 | Listed for rent | $1,695+6.3%$1/sqft |
Source: Zillow Rentals Report a problem | ||
| 10/25/2023 | Listing removed | -- |
Source: Zillow Rentals Report a problem | ||
| 10/14/2023 | Listed for rent | $1,595-11.1%$1/sqft |
Source: Zillow Rentals Report a problem | ||
| 9/16/2023 | Listing removed | -- |
Source: Zillow Rentals Report a problem | ||
| 9/1/2023 | Listed for rent | $1,795$1/sqft |
Source: Zillow Rentals Report a problem | ||
| 11/5/2022 | Listing removed | -- |
Source: Zillow Rental Manager Report a problem | ||
| 9/25/2022 | Price change | $1,795-3%$1/sqft |
Source: Zillow Rental Manager Report a problem | ||
| 9/19/2022 | Price change | $1,850-2.4%$1/sqft |
Source: Zillow Rental Manager Report a problem | ||
| 9/9/2022 | Listed for rent | $1,895$1/sqft |
Source: Zillow Rental Manager Report a problem | ||
| 10/16/2021 | Listing removed | -- |
Source: Zillow Rental Network Premium Report a problem | ||
| 10/2/2021 | Price change | $1,895-5%$1/sqft |
Source: Zillow Rental Network Premium Report a problem | ||
| 8/31/2021 | Listed for rent | $1,995+59.6%$1/sqft |
Source: Zillow Rental Network Premium Report a problem | ||
| 6/7/2019 | Listing removed | $1,250$1/sqft |
Source: REAL Star Property Management LLC Report a problem | ||
| 6/2/2019 | Listed for rent | $1,250$1/sqft |
Source: REAL Star Property Management LLC Report a problem | ||
| 1/31/2019 | Sold | -- |
Source: | ||
| Year | Property taxes | Tax assessment |
|---|---|---|
| 2025 | $4,477 -0.7% | $220,689 -2.5% |
| 2024 | $4,508 +9.8% | $226,281 +1.2% |
| 2023 | $4,104 +12.7% | $223,507 +29.2% |
| 2022 | $3,641 | $173,000 +16.6% |
| 2021 | -- | $148,400 +5.1% |
| 2020 | $3,053 +0% | $141,173 +16.7% |
| 2019 | $3,052 -8.1% | $121,000 -4.1% |
| 2018 | $3,321 +13.4% | $126,123 +1.6% |
| 2017 | $2,930 | $124,094 +5.8% |
| 2016 | $2,930 -14.1% | $117,309 -1.7% |
| 2015 | $3,412 | $119,290 -13.6% |
| 2014 | $3,412 | $138,147 +2.9% |
| 2013 | -- | $134,195 +1795.9% |
| 2008 | -- | $7,078 |
| 2007 | -- | $7,078 +137.5% |
| 2006 | -- | $2,980 |
Find assessor info on the county website
Source: Central Texas MLS. This data may not be complete. We recommend contacting the local school district to confirm school assignments for this home.
A local agent can set up tours, give advice and negotiate with sellers.
A local lender can help you make sure your offer is ready when you are.