Plantings
The properties are planted to the following walnut varieties:
+/-18 Acres: 2010 Tulare organic walnuts
+/-36 Acres: 2011 Tulare organic walnuts
+/-36 Acres: 2017 Chandler walnuts
Water
The property is within and receives deliveries from Consolidated Irrigation District.
Groundwater Disclosure
Sustainable Groundwater Management Act (SGMA) requires groundwater basins to be sustainable by 2040. SGMA may limit ground water pumping.
For more information, please visit the SGMA website.
The Buyer is responsible for conducting their own research to verify all information related to groundwater and surface water resources, including availability, usage rights, and potential restrictions.
Remarks
This property is being sold on an "AS-IS, WHERE-IS" basis.
Any sale of the Subject Property, or any portion thereof, is subject to the Court's
approval, and any such sale shall be subject to overbids and an auction at the
hearing on any such proposed sale ("Sale Hearing").
For sale
$3,772,470
5206 E Dinuba Avenue, Fowler, CA 93625
0beds
0baths
--sqft
Permanent Planting, Farm
Built in 1000
96.73 Acres Lot
$3,582,300 Zestimate®
$--/sqft
$-- HOA
What's special
- 13 days
- 80
- 2
Zillow last checked:
Listing updated:
Listed by:
Douglas J Phillips 559-805-4095,
Schuil Ag Real Estate
Source: TCMLS,MLS#: 244952
Facts & features
Interior
Bedrooms & bathrooms
- Bedrooms: 0
- Bathrooms: 0
Interior area
- Total structure area: 0
Property
Lot
- Size: 96.73 Acres
Details
- Additional parcels included: 34803068
- Parcel number: 34803049
Construction
Type & style
- Home type: SingleFamily
- Property subtype: Permanent Planting, Farm
Condition
- Year built: 1000
Utilities & green energy
- Sewer: None
- Water: Surface
Community & HOA
Location
- Region: Fowler
Financial & listing details
- Tax assessed value: $524,436
- Date on market: 11/3/2026
- Cumulative days on market: 14 days
Estimated market value
$3,582,300
$3.40M - $3.76M
Not available
Price history
| Date | Event | Price |
|---|---|---|
| 11/4/2026 | Listed for sale | $3,772,470+694.2% |
Source:  TCMLS #244952 Report a problem | ||
| 6/14/2021 | Sold | $475,000+9.2% |
Source: Public Record Report a problem | ||
| 4/23/2021 | Listed for sale | $435,000+117.5% |
Source:  Fresno MLS #558178 Report a problem | ||
| 11/10/2020 | Sold | $200,000 |
Source: Public Record Report a problem | ||
Public tax history
| Year | Property taxes | Tax assessment |
|---|---|---|
| 2026 | -- | $524,436 +2% |
| 2025 | $6,064 +3.4% | $514,154 +2% |
| 2024 | $5,863 +5.2% | $504,073 +2% |
| 2023 | $5,572 +1.4% | $494,190 +2% |
| 2022 | $5,493 +422% | $484,500 +453.7% |
| 2021 | $1,052 -4.3% | $87,500 -3.9% |
| 2020 | $1,099 +0.4% | $91,029 +2% |
| 2019 | $1,095 +5.8% | $89,245 +2% |
| 2018 | $1,035 +0.2% | $87,496 +2% |
| 2017 | $1,033 +10.6% | $85,782 +2% |
| 2016 | $934 -0.2% | $84,101 +1.5% |
| 2015 | $936 +5.8% | $82,839 +2% |
| 2014 | $885 | $81,217 +0.5% |
| 2013 | -- | $80,851 +2% |
| 2012 | -- | $79,266 +2% |
| 2011 | -- | $77,713 +0.8% |
| 2010 | -- | $77,133 -0.2% |
| 2009 | -- | $77,317 +2% |
| 2008 | -- | $75,802 +2% |
| 2007 | -- | $74,317 -61.5% |
| 2006 | -- | $193,000 |
Find assessor info on the county website
Monthly payment
Est. payment
Payment breakdown
Explore the cost of this home by adjusting the details. Changes won't be saved.Climate risks
Neighborhood: 93625

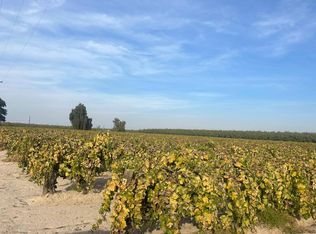
Similar homes
- $3,000,0003 bd2 ba2.8k sqft13616 E Bullard Ave, Clovis, CA 93619For Sale
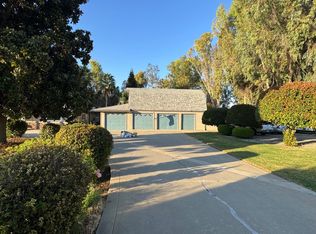 MLS ID #657897, Puneet Bhargava. Fresno MLS
- $1,931,310-- bd-- ba-- sqft0 S McCall Ave, Selma, CA 93662For Sale
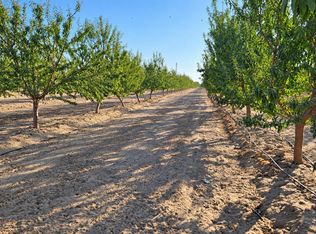 MLS ID #656903, Arshdeep Singh. Fresno MLS
- $2,200,0002 bd1 ba-- sqft5601 E Clarkson Ave, Selma, CA 93662For Sale
 MLS ID #234320, Fernando Manuel Santos. Kings County MLS
- $2,400,0003 bd4 ba2.4k sqft20270 S Clovis Ave, Laton, CA 93242For Sale
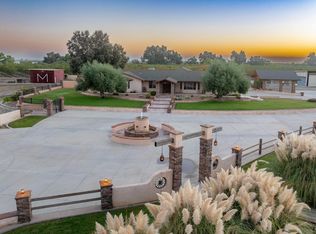 MLS ID #235244, Blake C. Grilione. Kings County MLS
