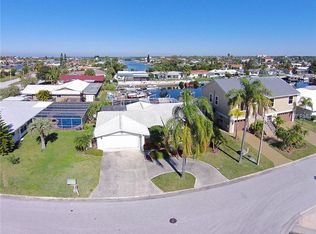
This is a 2324 square foot, 2.0 bathroom, single family home. This home is located at 5206 Leeward Ln, New Port Richey, FL 34652.
Pre-foreclosure
Street View
Est. $765,800
5206 Leeward Ln, New Port Richey, FL 34652
--beds
2baths
2,324sqft
SingleFamily
Built in 1975
9,191 Square Feet Lot
$765,800 Zestimate®
$330/sqft
$61/mo HOA
Overview
- 136 days |
- 2 |
- 0 |
Facts & features
Interior
Bedrooms & bathrooms
- Bathrooms: 2
Heating
- Forced air
Cooling
- Central
Features
- Flooring: Other, Carpet
Interior area
- Total interior livable area: 2,324 sqft
Property
Parking
- Parking features: Garage - Attached
Features
- Exterior features: Stucco
- Has view: Yes
- View description: Water
- Has water view: Yes
- Water view: Water
Lot
- Size: 9,191 Square Feet
Details
- Parcel number: 122615079D022000360
Construction
Type & style
- Home type: SingleFamily
Materials
- Concrete Block
- Roof: Other
Condition
- Year built: 1975
Community & HOA
HOA
- Has HOA: Yes
- HOA fee: $61 monthly
Location
- Region: New Port Richey
Financial & listing details
- Price per square foot: $330/sqft
- Tax assessed value: $768,276
- Annual tax amount: $5,196
Visit our professional directory to find a foreclosure specialist in your area that can help with your home search.
Find a foreclosure agentForeclosure details
Estimated market value
$765,800
$682,000 - $858,000
$3,039/mo
Price history
| Date | Event | Price |
|---|---|---|
| 6/29/2007 | Sold | $393,000$169/sqft |
Source: Stellar MLS #W7281979 Report a problem | ||
Public tax history
| Year | Property taxes | Tax assessment |
|---|---|---|
| 2024 | $5,196 +3.7% | $327,460 |
| 2023 | $5,012 +13.4% | $327,460 +3% |
| 2022 | $4,419 +1.8% | $317,930 +6.1% |
| 2021 | $4,341 +1.5% | $299,680 +1.4% |
| 2020 | $4,275 +1.6% | $295,550 +2.3% |
| 2019 | $4,207 | $288,910 +1.9% |
| 2018 | $4,207 +1.8% | $283,531 |
| 2017 | $4,133 +0.4% | $283,531 +4.2% |
| 2016 | $4,117 +0.5% | $271,987 +0.7% |
| 2015 | $4,096 +8.2% | $270,096 -9.4% |
| 2014 | $3,787 | $298,254 +16.8% |
| 2013 | -- | $255,307 +2.9% |
| 2012 | -- | $248,025 -3.1% |
| 2011 | -- | $255,905 -4.7% |
| 2010 | -- | $268,642 -13.2% |
| 2009 | -- | $309,383 -24.5% |
| 2008 | -- | $409,604 -5.5% |
| 2007 | -- | $433,443 -14.2% |
| 2006 | -- | $505,106 +42.5% |
| 2005 | -- | $354,548 +24.1% |
| 2004 | -- | $285,786 +31.3% |
| 2003 | -- | $217,625 +16.5% |
| 2002 | -- | $186,822 +20.8% |
| 2000 | -- | $154,601 +7.3% |
| 1999 | -- | $144,068 |
Find assessor info on the county website
Monthly payment
Estimated monthly payment$1,822
All calculations are estimates and provided by Zillow, Inc. for informational purposes only. Actual amounts may vary.
HOA fees may include property taxes on listings classified as Co-Ops. Contact the listing agent and/or owner for fee details.
Mortgage interest rates are dependent on a number of factors, including credit score, down payment, and repayment length. Interest rate data provided by Zillow Group Marketplace, Inc. as of 1/1/1970 from various mortgage lenders with which we have lead or other similar arrangements; the Estimated Payment is an average of those rates.
See how much you could borrow to make a competitive offer.
Climate risks
Neighborhood: Flor-A-Mar
Nearby schools
GreatSchools rating
- 7/10James M. Marlowe Elementary SchoolGrades: PK-5Distance: 2.2 mi
- 2/10Gulf Middle SchoolGrades: 6-8Distance: 3 mi
- 3/10Gulf High SchoolGrades: 9-12Distance: 2.5 mi


- Florida
- Pasco County
- New Port Richey
- 34652
- Flor-A-Mar
- 5206 Leeward Ln
Nearby cities
Nearby neighborhoods
Nearby zip codes
Other New Port Richey Topics
