Investment Property – Sold As Is
Great investment opportunity! This 1,890 sq. ft. home features 4 bedrooms and 2 bathrooms, offering plenty of potential for investors, flippers, or buyers looking to renovate and add value. Property is being sold as is. Seller will make no repairs.
For sale by owner
$285,000
5212 W Vernon Ave, Phoenix, AZ 85035
4beds
1,890sqft
SingleFamily
Built in 1968
6,299 Square Feet Lot
$-- Zestimate®
$151/sqft
$-- HOA
Overview
- 30 days
- 1,151
- 44
Listed by:
Property Owner (602) 565-9094
Facts & features
Interior
Bedrooms & bathrooms
- Bedrooms: 4
- Bathrooms: 2
- Full bathrooms: 2
Heating
- Other
Cooling
- Refrigerator
Interior area
- Total interior livable area: 1,890 sqft
Property
Features
- Exterior features: Cement / Concrete
Lot
- Size: 6,299 Square Feet
Details
- Parcel number: 10317240B
Construction
Type & style
- Home type: SingleFamily
Materials
- Roof: Asphalt
Condition
- New construction: No
- Year built: 1968
Community & HOA
Location
- Region: Phoenix
Financial & listing details
- Price per square foot: $151/sqft
- Tax assessed value: $253,500
- Annual tax amount: $1,046
- Date on market: 10/11/2026
Estimated market value
Not available
Estimated sales range
Not available
$2,099/mo
Price history
| Date | Event | Price |
|---|---|---|
| 10/27/2026 | Listing removed | -- |
Source: Owner Report a problem | ||
| 10/22/2026 | Pending sale | $285,000$151/sqft |
Source: Owner Report a problem | ||
| 10/11/2026 | Listed for sale | $285,000$151/sqft |
Source: Owner Report a problem | ||
Public tax history
| Year | Property taxes | Tax assessment |
|---|---|---|
| 2025 | $1,046 +2.8% | $25,350 -9% |
| 2024 | $1,018 -2.3% | $27,850 +408.4% |
| 2023 | $1,041 +5.1% | $5,478 -68.8% |
| 2022 | $991 +4.2% | $17,550 +14.6% |
| 2021 | $951 +4.5% | $15,310 +8.6% |
| 2020 | $910 -12.1% | $14,100 +16.4% |
| 2019 | $1,035 | $12,110 +8.4% |
| 2018 | $1,035 +25.3% | $11,170 +26.2% |
| 2017 | $826 +13.5% | $8,850 +14.5% |
| 2016 | $728 -2.1% | $7,730 +14.9% |
| 2015 | $743 | $6,730 +52.3% |
| 2014 | -- | $4,420 +37.7% |
| 2013 | -- | $3,210 -9.6% |
| 2012 | -- | $3,550 -0.6% |
| 2011 | -- | $3,570 -34.9% |
| 2010 | -- | $5,480 -59.6% |
| 2009 | -- | $13,570 -8% |
| 2008 | -- | $14,750 +25% |
| 2007 | -- | $11,800 +41.3% |
| 2006 | -- | $8,350 |
| 2005 | -- | $8,350 +16.8% |
| 2004 | -- | $7,150 |
| 2003 | -- | $7,150 +27.7% |
| 2002 | -- | $5,600 |
Find assessor info on the county website
Monthly payment
Est. payment
Payment breakdown
Explore the cost of this home by adjusting the details. Changes won't be saved.Climate risks
Neighborhood: Maryvale


Similar homes
- $--4 bd2 ba1.6k sqft4807 W Windsor Ave, Phoenix, AZ 85035AuctionAuction.com 2
- $295,0003 bd2 ba1.4k sqft5526 W LEWIS Avenue, Phoenix, AZ 85035For Sale
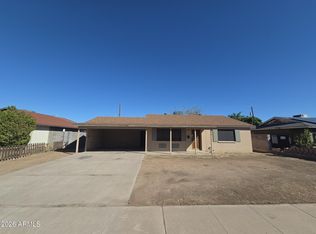 MLS ID #7096982, Sinan Zakaria, LISTED SIMPLY. ARMLS
- $280,0004 bd3 ba1.4k sqft2509 N 49TH Avenue, Phoenix, AZ 85035For Sale
 MLS ID #7021724, Ulyses Castillo, A.Z. & Associates. ARMLS
- $--3 bd2 ba1.8k sqft6008 W Palm Ln, Phoenix, AZ 85035Auction
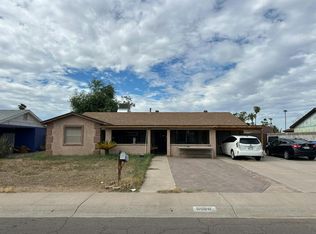 Auction.com 2
