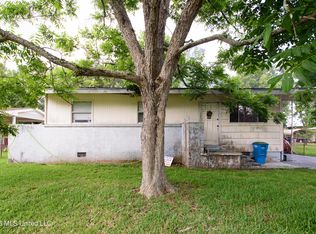
Bring your vision and creativity to this fixer-upper! This property offers a great opportunity for investors or buyers looking to renovate and make it their own. With the right improvements and a little TLC, this property has the potential to shine. Whether you're looking for your next investment project or a home to customize, don't miss the opportunity to bring this property back to life. Schedule your showing today!
Active
$59,900
5213 Meridian St, Moss Point, MS 39563
3beds
1,260sqft
Residential, Single Family Residence
Built in 1981
7,840 Square Feet Lot
$-- Zestimate®
$48/sqft
$-- HOA
What's special
- 3 days
- 72
- 7
Zillow last checked:
Listing updated:
Listed by:
Marenda Harper 228-235-1698,
Harper Realty, LLC. 228-205-2682
Source: MLS United,MLS#: 4167911
Facts & features
Interior
Bedrooms & bathrooms
- Bedrooms: 3
- Bathrooms: 2
- Full bathrooms: 2
Heating
- Central
Cooling
- Central Air
Appliances
- Included: Electric Range
Features
- Has fireplace: No
Interior area
- Total structure area: 1,260
- Total interior livable area: 1,260 sqft
Video & virtual tour
Property
Parking
- Parking features: Driveway
- Has uncovered spaces: Yes
Features
- Levels: One
- Stories: 1
- Exterior features: None
Lot
- Size: 7,840 Square Feet
Details
- Parcel number: 21470143.000
Construction
Type & style
- Home type: SingleFamily
- Property subtype: Residential, Single Family Residence
Materials
- Vinyl
- Foundation: Pillar/Post/Pier
- Roof: Architectural Shingles
Condition
- Fixer
- New construction: No
- Year built: 1981
Utilities & green energy
- Sewer: Public Sewer
- Water: Public
- Utilities for property: Electricity Available, Sewer Available, Water Available
Community & HOA
Community
- Subdivision: Jackson Park
HOA
- Has HOA: No
Location
- Region: Moss Point
Financial & listing details
- Price per square foot: $48/sqft
- Tax assessed value: $25,396
- Annual tax amount: $334
- Date on market: 11/9/2026
- Electric utility on property: Yes
Estimated market value
Not available
Estimated sales range
Not available
$1,119/mo
Price history
| Date | Event | Price |
|---|---|---|
| 11/9/2026 | Listed for sale | $59,900+9.1%$48/sqft |
Source: MLS United #4167911 Report a problem | ||
| 11/3/2026 | Listing removed | -- |
Source: Owner Report a problem | ||
| 11/3/2026 | Price change | $54,900-8.3%$44/sqft |
Source: Owner Report a problem | ||
| 10/27/2026 | Listed for sale | $59,900+22.5%$48/sqft |
Source: Owner Report a problem | ||
| 1/7/2026 | Listing removed | $48,900$39/sqft |
Source: MLS United #4133992 Report a problem | ||
| 1/5/2026 | Price change | $48,900-2%$39/sqft |
Source: MLS United #4133992 Report a problem | ||
| 12/29/2025 | Price change | $49,900-7.4%$40/sqft |
Source: MLS United #4133992 Report a problem | ||
| 12/22/2025 | Price change | $53,900-2%$43/sqft |
Source: MLS United #4133992 Report a problem | ||
| 12/16/2025 | Listed for sale | $55,000$44/sqft |
Source: MLS United #4133992 Report a problem | ||
Public tax history
| Year | Property taxes | Tax assessment |
|---|---|---|
| 2025 | $334 +5.8% | $2,540 -42.2% |
| 2024 | $316 +5.1% | $4,395 |
| 2023 | $300 +1.6% | $4,395 |
| 2022 | $296 +1% | $4,395 -0.8% |
| 2021 | $293 -15.7% | $4,429 +58.2% |
| 2020 | $347 +0.3% | $2,800 |
| 2018 | $346 | $2,800 |
| 2017 | $346 +298.7% | $2,800 |
| 2016 | $87 | $2,800 -90.2% |
| 2015 | $87 -0.1% | $28,600 +819.6% |
| 2014 | $87 -10.2% | $3,110 |
| 2013 | $97 -74.7% | $3,110 |
| 2012 | $382 -1.9% | $3,110 -2.6% |
| 2011 | $389 -50.2% | $3,193 -33.3% |
| 2010 | $782 +1.1% | $4,790 +1.1% |
| 2009 | $774 -0.1% | $4,738 |
| 2008 | $775 -3.4% | $4,738 +1.8% |
| 2007 | $802 -2.1% | $4,652 |
| 2006 | $819 | $4,652 |
| 2005 | $819 | $4,652 |
| 2004 | $819 +2.3% | $4,652 |
| 2003 | $800 +3.5% | $4,652 |
| 2002 | $773 +23.8% | $4,652 +27.9% |
| 2001 | $624 | $3,636 |
| 2000 | $624 | $3,636 |
Find assessor info on the county website
Monthly payment
Est. payment
Payment breakdown
Explore the cost of this home by adjusting the details. Changes won't be saved.Climate risks
Neighborhood: 39563
Similar homes
- $75,0003 bd2 ba1.7k sqft4918 Hubert St, Moss Point, MS 39563For Sale
 MLS ID #4158740, Barbara M Payne Jenkins, Payne Property, LLC. MLS United
- $62,5003 bd1 ba1.3k sqft2311 Choctaw Ave, Pascagoula, MS 39567Auction
 Xome
- $52,9003 bd2 ba1.2k sqft2818 Criswell Ave, Pascagoula, MS 39567For Sale
 MLS ID #4154906, Charlie F Green, Charlie Green Real Estate. MLS United
- $49,0003 bd1 ba1.1k sqft7325 Grierson St, Moss Point, MS 39563For Sale
 MLS ID #4150515, Yari Garcia, eAgent United. MLS United
