Great opportunity to own this 2-bedroom, 1-bath home in Tulare! The home features a functional floor plan with carpet and vinyl flooring, a tub/shower combination, wall furnace, evaporative cooler, and two window A/C units. Laundry hookups are conveniently located outside. With some TLC and updating, this property offers plenty of potential for a buyer or investor looking to make it their own. Property is being sold AS-IS.
For sale
$225,000
523 N G Street, Tulare, CA 93274
2beds
712sqft
Single Family Residence, Residential
Built in 1918
7,910 Square Feet Lot
$221,400 Zestimate®
$316/sqft
$-- HOA
What's special
Functional floor planCarpet and vinyl flooring
- 37 days
- 257
- 4
Zillow last checked:
Listing updated:
Listed by:
Gracie Guerrero-Sousa 559-684-2159,
Sousa Valley Real Estate
Source: TCMLS,MLS#: 244030
Facts & features
Interior
Bedrooms & bathrooms
- Bedrooms: 2
- Bathrooms: 1
- Full bathrooms: 1
Heating
- Wall Furnace
Cooling
- Evaporative Cooling
Appliances
- Included: Gas Range
- Laundry: Outside
Features
- Flooring: Carpet, Linoleum
- Has fireplace: No
Interior area
- Total structure area: 712
- Total interior livable area: 712 sqft
Property
Features
- Stories: 1
Lot
- Size: 7,910 Square Feet
- Dimensions: 50 x 160
Details
- Parcel number: 169201015000
Construction
Type & style
- Home type: SingleFamily
- Property subtype: Single Family Residence, Residential
Materials
- Roof: Composition
Condition
- Fixer
- New construction: No
- Year built: 1918
Utilities & green energy
- Sewer: Public Sewer
- Water: Public
- Utilities for property: Electricity Connected, Natural Gas Connected, Sewer Connected, Water Connected
Community & HOA
HOA
- Has HOA: No
Location
- Region: Tulare
Financial & listing details
- Price per square foot: $316/sqft
- Tax assessed value: $52,240
- Date on market: 9/11/2026
- Electric utility on property: Yes
Estimated market value
$221,400
$210,000 - $232,000
$1,316/mo
Price history
| Date | Event | Price |
|---|---|---|
| 9/11/2026 | Listed for sale | $225,000$316/sqft |
Source:  TCMLS #244030 Report a problem | ||
Public tax history
| Year | Property taxes | Tax assessment |
|---|---|---|
| 2026 | -- | $52,240 +2% |
| 2025 | $559 +0.3% | $51,216 +2% |
| 2024 | $557 +2.6% | $50,212 +2% |
| 2023 | $543 +3% | $49,228 +2% |
| 2022 | $527 +1.3% | $48,264 +2% |
| 2021 | $521 -1.6% | $47,318 +1% |
| 2020 | $529 -2.4% | $46,832 +2% |
| 2019 | $543 +1.6% | $45,914 +2% |
| 2018 | $534 +0.9% | $45,014 +2% |
| 2017 | $529 +4.6% | $44,132 +2% |
| 2016 | $506 | $43,266 +1.5% |
| 2015 | $506 +3.5% | $42,616 +2% |
| 2014 | $489 | $41,782 +0.5% |
| 2013 | -- | $41,594 +2% |
| 2012 | -- | $40,778 +2% |
| 2011 | -- | $39,978 +4.6% |
| 2007 | -- | $38,230 +2% |
| 2006 | -- | $37,480 +2% |
| 2005 | -- | $36,746 +2% |
| 2004 | -- | $36,026 +1.9% |
| 2003 | -- | $35,364 +2% |
| 2002 | -- | $34,670 +2% |
| 2001 | -- | $33,990 |
Find assessor info on the county website
Monthly payment
Est. payment
Payment breakdown
Explore the cost of this home by adjusting the details. Changes won't be saved.Climate risks
Neighborhood: 93274
Similar homes
- $225,0002 bd1 ba786 sqft462 N E Street, Tulare, CA 93274For Sale
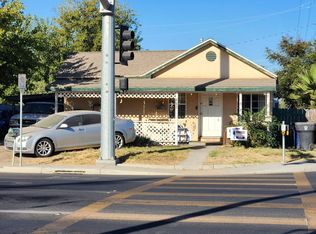 MLS ID #244029, Gracie Guerrero-Sousa, Sousa Valley Real Estate. TCMLS
- $230,0003 bd1 ba988 sqft361 N G Street, Tulare, CA 93274For Sale
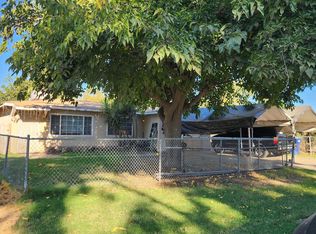 MLS ID #244028, Gracie Guerrero-Sousa, Sousa Valley Real Estate. TCMLS
- $249,9752 bd1 ba748 sqft116 S West Street, Tulare, CA 93274For Sale
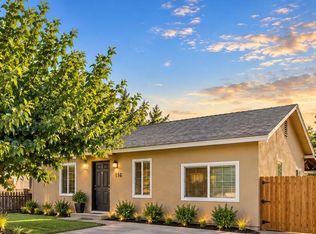 MLS ID #244096, Cathalina Mendez, Legacy Real Estate Inc. TCMLS
- $247,2502 bd1 ba672 sqft124 S West Street, Tulare, CA 93274For Sale
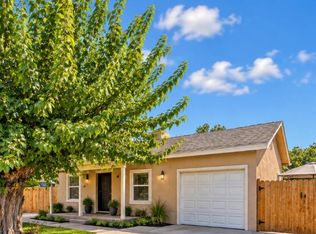 MLS ID #244088, Cathalina Mendez, Legacy Real Estate Inc. TCMLS
