Excellent investment opportunity! This 3-bedroom, 2-bathroom single-family home offers immediate rental income and long-term investment potential. The property currently generates $1,750 per month in rental income, with a 2-year lease already in place, providing a steady income stream for the new owner.
Featuring a functional layout, comfortable living spaces, and plenty of potential, this home is ready for its next chapter.
Enjoy the convenience of a Cincinnati location close to local shopping, dining, schools, parks, and major roadways. This property promising investment opportunity
Don't miss the opportunity to make 527 W 63rd St your next home or investment! Schedule your showing today.
For sale
$179,900
527 W 63rd St, Cincinnati, OH 45216
3beds
1,440sqft
Single Family Residence
Built in 1910
3,750 Square Feet Lot
$169,200 Zestimate®
$125/sqft
$-- HOA
What's special
Functional layoutComfortable living spaces
- 23 days
- 362
- 15
Zillow last checked:
Listing updated:
Listed by:
Aida Badalova (412)3206975Aidabadalova@kw.com,
Keller Williams Home Town Rlty
Source: DABR MLS,MLS#: 971604 Originating MLS: Dayton Area Board of REALTORS
Facts & features
Interior
Bedrooms & bathrooms
- Bedrooms: 3
- Bathrooms: 2
- Full bathrooms: 2
- Main level bathrooms: 1
Bedroom
- Level: Second
- Dimensions: 13 x 12
Bedroom
- Level: Second
- Dimensions: 10 x 13
Bedroom
- Level: Main
- Dimensions: 13 x 11
Heating
- Natural Gas
Cooling
- Window Unit(s)
Features
- Basement: Unfinished
Interior area
- Total structure area: 1,440
- Total interior livable area: 1,440 sqft
Property
Parking
- Parking features: No Garage
Features
- Levels: Two
- Stories: 2
Lot
- Size: 3,750 Square Feet
- Dimensions: 30 x 125
Details
- Parcel number: 2410002020200
- Zoning: Residential
- Zoning description: Residential
Construction
Type & style
- Home type: SingleFamily
- Property subtype: Single Family Residence
Materials
- Other
Condition
- Year built: 1910
Community & HOA
HOA
- Has HOA: No
Location
- Region: Cincinnati
Financial & listing details
- Price per square foot: $125/sqft
- Tax assessed value: $35,000
- Annual tax amount: $785
- Date on market: 10/6/2026
Estimated market value
$169,200
$157,000 - $178,000
$1,503/mo
Price history
| Date | Event | Price |
|---|---|---|
| 10/20/2026 | Listed for sale | $179,900+1450.9%$125/sqft |
Source:  DABR MLS #971604 Report a problem | ||
| 3/4/2026 | Listing removed | $1,750$1/sqft |
Source: Zillow Rentals Report a problem | ||
| 2/25/2026 | Listed for rent | $1,750$1/sqft |
Source: Zillow Rentals Report a problem | ||
| 2/9/2026 | Listing removed | $1,750$1/sqft |
Source: Zillow Rentals Report a problem | ||
| 2/9/2026 | Price change | $1,750+9.4%$1/sqft |
Source: Zillow Rentals Report a problem | ||
| 1/31/2026 | Listed for rent | $1,600$1/sqft |
Source: Zillow Rentals Report a problem | ||
| 4/14/2023 | Sold | $11,600-92.3%$8/sqft |
Source: Public Record Report a problem | ||
| 1/31/2022 | Listing removed | -- |
Source:  Cincy MLS #1719102 Report a problem | ||
| 1/6/2022 | Price change | $150,000-6.3%$104/sqft |
Source: Cincy MLS #1719102 Report a problem | ||
| 11/20/2021 | Price change | $160,000-5.9%$111/sqft |
Source: Cincy MLS #1719102 Report a problem | ||
| 10/14/2021 | Listed for sale | $170,000+385.7%$118/sqft |
Source: Cincy MLS #1719102 Report a problem | ||
| 3/10/2021 | Sold | $35,000+105.9%$24/sqft |
Source: Public Record Report a problem | ||
| 5/20/2005 | Sold | $17,000$12/sqft |
Source: Cincy MLS #929046 Report a problem | ||
Public tax history
| Year | Property taxes | Tax assessment |
|---|---|---|
| 2025 | $785 +0.1% | $12,250 |
| 2024 | $784 -0.2% | $12,250 |
| 2023 | $785 +165.9% | $12,250 +201.7% |
| 2022 | $295 -2.6% | $4,060 |
| 2021 | $303 +5.1% | $4,060 |
| 2020 | $288 -28.2% | $4,060 +16% |
| 2019 | $401 -77.9% | $3,500 |
| 2018 | $1,816 +25.1% | $3,500 |
| 2017 | $1,452 +389.8% | $3,500 |
| 2016 | $296 -63.6% | $3,500 -70.8% |
| 2015 | $814 -0.5% | $12,005 |
| 2014 | $818 -1.7% | $12,005 |
| 2013 | $832 +2.3% | $12,005 |
| 2012 | $814 +1.5% | $12,005 |
| 2011 | $801 -40.2% | $12,005 -45.1% |
| 2010 | $1,339 +1.7% | $21,851 |
| 2009 | $1,317 +1.5% | $21,851 |
| 2008 | $1,298 +11.8% | $21,851 -2% |
| 2007 | $1,161 +1.1% | $22,295 |
| 2006 | $1,148 +2.7% | $22,295 |
| 2005 | $1,117 -2.9% | $22,295 +5.8% |
| 2003 | $1,151 +6.7% | $21,070 |
| 2002 | $1,079 +1.9% | $21,070 +6.7% |
| 2001 | $1,059 +3.4% | $19,740 |
| 2000 | $1,024 | $19,740 |
Find assessor info on the county website
Monthly payment
Est. payment
Payment breakdown
Explore the cost of this home by adjusting the details. Changes won't be saved.Climate risks
Neighborhood: Carthage
Nearby schools
Schools provided by the listing agent
- District: Cincinnati
Source: DABR MLS. This data may not be complete. We recommend contacting the local school district to confirm school assignments for this home.


Similar homes
- $170,0003 bd2 ba1.3k sqft518 Linden St, Cincinnati, OH 45216For Sale
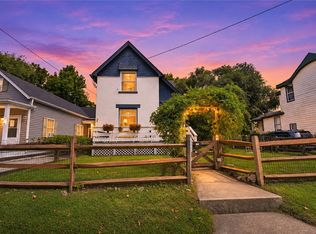
 MLS ID #969045, Miranda K Biedenharn, Comey & Shepherd REALTORS. DABR MLS
- $175,0003 bd2 ba1.4k sqft320 Grove Ct, Cincinnati, OH 45215For Sale
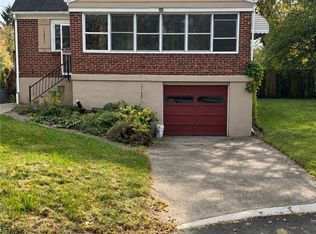 MLS ID #972018, Kimberly A Thorpe, Comey & Shepherd REALTORS. DABR MLS
- $187,5003 bd2 ba1.7k sqft5109 Silver St, Cincinnati, OH 45212For Sale
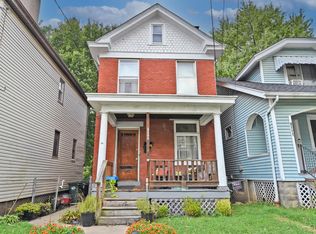
 MLS ID #1893895, John M Durso, Comey & Shepherd. Cincy MLS
- $255,0004 bd2 ba1.8k sqft133 Wildwood St, Cincinnati, OH 45216For Sale
 MLS ID #1880287, Jimmie Powell, OwnerLand Realty, Inc.. Cincy MLS
- $165,0002 bd3 ba1.2k sqft4613 W Mitchell Ave, Cincinnati, OH 45232For SaleMLS ID #1892548, Matthew Wielgos, Plum Tree Realty. Cincy MLS
- $199,0002 bd2 ba1.1k sqft3864 Odin Ave, Cincinnati, OH 45213For SaleMLS ID #1899636, George G Emmons, Keller Williams Seven Hills Re. Cincy MLS
- $189,5003 bd3 ba1.4k sqft3038 Percy Ave, Cincinnati, OH 45211For SaleMLS ID #1892539, Adrienne N Shipman, Keller Williams Seven Hills Re. Cincy MLS
- $165,0003 bd1 ba1.5k sqft3566 Vine St, Cincinnati, OH 45220For SaleMLS ID #1895929, Javaria Usmani, Plum Tree Realty. Cincy MLS
- $209,0004 bd2 ba1.3k sqft1826 Maple Ave, Cincinnati, OH 45212For SaleMLS ID #1897847, Devonna Kirkland, eXp Realty. Cincy MLS
- $219,0003 bd2 ba1.4k sqft891 Ridgeway Ave, Cincinnati, OH 45229For SaleMLS ID #1895420, Heather R. Herr, Private Real Estate Collection. Cincy MLS
- $249,9003 bd2 ba2k sqft8346 Woodbine Ave, Cincinnati, OH 45216For SaleMLS ID #1889104, Sasi R Pullalarevu, Plum Tree Realty. Cincy MLS
- $210,0003 bd2 ba1.6k sqft1807 Waltham Ave, Cincinnati, OH 45239For SaleMLS ID #1894934, Akshaya Devendra, Fortune Vine Realty. Cincy MLS
- $210,0003 bd3 ba1.1k sqft3765 Iona Ave, Cincinnati, OH 45213For SaleMLS ID #954356, Tim Cottrill, Sibcy Cline Inc.. DABR MLS
- $191,9003 bd1 ba1.3k sqft2268 Rice St, Cincinnati, OH 45219For SaleMLS ID #1882723, Troy Kutcha, Plum Tree Realty. Cincy MLS
- $190,0003 bd2 ba1.4k sqft329 Stanley Ave, Cincinnati, OH 45226For SaleMLS ID #1893390, Laura M. Zembrodt, Comey & Shepherd. Cincy MLS
- $169,0003 bd2 ba1.4k sqft655 Steiner Ave, Cincinnati, OH 45204For SaleMLS ID #1897633, Steven R Seng, Huff Realty. Cincy MLS
- $179,9953 bd1 ba925 sqft9884 Dunraven Dr, Cincinnati, OH 45251For SaleMLS ID #1897534, Ronald Hill, JoAnn Jones & Assoc. Realty. Cincy MLS
- $165,0003 bd2 ba1.4k sqft3337 Glenway Ave, Cincinnati, OH 45205For SaleMLS ID #1887708, Rajib Garu, Fortune Vine Realty. Cincy MLS
- $245,0003 bd2 ba1.5k sqft8505 Mockingbird Ln, Cincinnati, OH 45231For SaleMLS ID #1899663, Conor Doyle, eXp Realty. Cincy MLS
