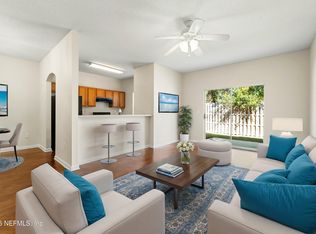
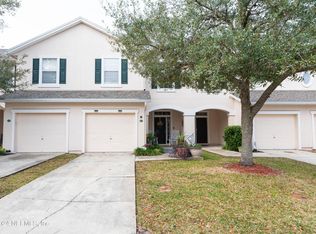
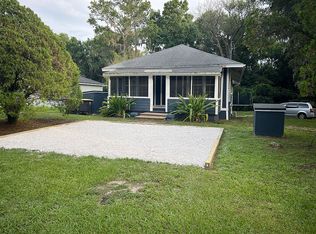
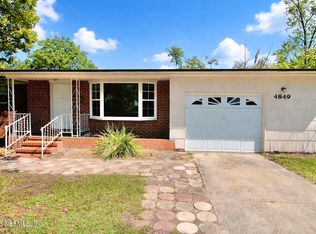
This 1592 square foot single family home has 3 bedrooms and 2.0 bathrooms. This home is located at 5270 Collins Rd, Jacksonville, FL 32244.
Foreclosed
Est. $239,700
5270 Collins Rd, Jacksonville, FL 32244
3beds
2baths
1,592sqft
SingleFamily
Built in 1959
0.4 Acres Lot
$239,700 Zestimate®
$151/sqft
$-- HOA
Overview
- 28 days |
- 9 |
- 0 |
Facts & features
Interior
Bedrooms & bathrooms
- Bedrooms: 3
- Bathrooms: 2
Heating
- central, Electric
Cooling
- Central
Appliances
- Included: Microwave, Refrigerator
Features
- Flooring: Tile, Hardwood
- Has fireplace: Yes
Interior area
- Total interior livable area: 1,592 sqft
Property
Parking
- Total spaces: 2
- Parking features: None, Garage
Features
- Exterior features: Other, Cement / Concrete
Lot
- Size: 0.4 Acres
- Features: Regular Lot
Details
- Parcel number: 0991090000
Construction
Type & style
- Home type: SingleFamily
Materials
- Roof: Other
Condition
- Year built: 1959
Community & HOA
Location
- Region: Jacksonville
Financial & listing details
- Price per square foot: $151/sqft
- Tax assessed value: $229,149
- Annual tax amount: $4,306
Visit our professional directory to find a foreclosure specialist in your area that can help with your home search.
Find a foreclosure agentForeclosure details
Estimated market value
$239,700
$221,000 - $259,000
$1,635/mo
Price history
| Date | Event | Price |
|---|---|---|
| 5/18/2026 | Sold | $165,800-39.7%$104/sqft |
Source: Public Record Report a problem | ||
| 8/22/2023 | Listing removed | -- |
Source: realMLS #1236838 Report a problem | ||
| 7/11/2023 | Listed for rent | $1,950+69.6%$1/sqft |
Source: realMLS #1236838 Report a problem | ||
| 5/1/2023 | Sold | $275,000$173/sqft |
Source: | ||
| 3/24/2023 | Price change | $275,000-1.1%$173/sqft |
Source: | ||
| 2/24/2023 | Price change | $278,000-0.7%$175/sqft |
Source: | ||
| 2/13/2023 | Price change | $280,000-1.1%$176/sqft |
Source: | ||
| 1/24/2023 | Price change | $283,000-0.4%$178/sqft |
Source: | ||
| 1/4/2023 | Price change | $284,000-0.4%$178/sqft |
Source: | ||
| 12/19/2022 | Price change | $285,000-1.7%$179/sqft |
Source: | ||
| 11/30/2022 | Price change | $290,000-1.4%$182/sqft |
Source: | ||
| 11/23/2022 | Price change | $294,000-1.7%$185/sqft |
Source: | ||
| 11/10/2022 | Listed for sale | $299,000+75.9%$188/sqft |
Source: | ||
| 6/23/2022 | Sold | $170,000+330.4%$107/sqft |
Source: Public Record Report a problem | ||
| 9/1/2019 | Listing removed | $1,150$1/sqft |
Source: SAN MARCO REALTY #1012342 Report a problem | ||
| 8/22/2019 | Listed for rent | $1,150$1/sqft |
Source: San Marco Properties, Inc. Report a problem | ||
| 7/24/2014 | Sold | $39,500-53.5%$25/sqft |
Source: Public Record Report a problem | ||
| 5/1/2014 | Listed for sale | $85,000$53/sqft |
Source: San Marco Realty #715861 Report a problem | ||
Public tax history
| Year | Property taxes | Tax assessment |
|---|---|---|
| 2024 | $4,306 +12.3% | $229,149 +13.6% |
| 2023 | $3,835 +103.9% | $201,786 +111.4% |
| 2022 | $1,881 +8.7% | $95,444 +10% |
| 2021 | $1,730 +2.7% | $86,768 +3.7% |
| 2020 | $1,685 +4.7% | $83,641 +6.9% |
| 2019 | $1,609 +1.2% | $78,233 +2.3% |
| 2018 | $1,590 | $76,483 +1.7% |
| 2017 | $1,590 +0.5% | $75,193 +7.6% |
| 2016 | $1,583 +4.9% | $69,892 +6.4% |
| 2015 | $1,509 +3.9% | $65,712 +7.5% |
| 2014 | $1,453 | $61,109 -0.1% |
| 2013 | -- | $61,141 -2.1% |
| 2012 | -- | $62,446 -4.5% |
| 2011 | -- | $65,355 -9% |
| 2010 | -- | $71,841 -9.8% |
| 2009 | -- | $79,635 +9.4% |
| 2006 | -- | $72,825 +9.8% |
| 2005 | $1,232 | $66,309 +7.1% |
| 2004 | -- | $61,909 +3% |
| 2003 | $1,166 | $60,109 -48.8% |
| 2002 | -- | $117,496 +1.8% |
| 2001 | -- | $115,391 +6.7% |
| 2000 | -- | $108,172 -8.5% |
| 1999 | -- | $118,272 |
Find assessor info on the county website
Monthly payment
Estimated monthly payment$1,822
All calculations are estimates and provided by Zillow, Inc. for informational purposes only. Actual amounts may vary.
HOA fees may include property taxes on listings classified as Co-Ops. Contact the listing agent and/or owner for fee details.
Mortgage interest rates are dependent on a number of factors, including credit score, down payment, and repayment length. Interest rate data provided by Zillow Group Marketplace, Inc. as of 1/1/1970 from various mortgage lenders with which we have lead or other similar arrangements; the Estimated Payment is an average of those rates.
See how much you could borrow to make a competitive offer.
Climate risks
Neighborhood: Ortega Hills
Nearby schools
GreatSchools rating
- 5/10Venetia Elementary SchoolGrades: K-5Distance: 3.7 mi
- 2/10J. E. B. Stuart Middle SchoolGrades: 6-8Distance: 4.1 mi
- 3/10Robert E. Lee High SchoolGrades: 9-12Distance: 7.7 mi


- Florida
- Duval County
- Jacksonville
- 32244
- Ortega Hills
- 5270 Collins Rd
Nearby cities
Nearby neighborhoods
Nearby zip codes
Other Jacksonville Topics
