Great opportunity to own a residential vacant lot in the heart of Chicago's New City neighborhood. Zoned RS-3, perfect for building a single-family home or investment property. Conveniently located near parks, schools, public transportation, and major expressways. Don't miss your chance to invest in this growing area!
Active
$10,499
5323 S Wolcott Ave, Chicago, IL 60609
--beds
--baths
3,075Square Feet
Unimproved Land
Built in ----
3,075 Square Feet Lot
$-- Zestimate®
$--/sqft
$-- HOA
What's special
- --
- 52
- views
- 5
- saves
Zillow last checked:
Listing updated:
Listed by:
Victor H Tierrafria (773)297-9948,
RE/MAX Premier
Source: MRED as distributed by MLS GRID,MLS#: 12796947
Facts & features
Interior
Video & virtual tour
Property
Features
- Frontage length: 25
Lot
- Size: 3,075 Square Feet
- Dimensions: 25X123
Details
- Parcel number: 20074180090000
- Special conditions: None
Utilities & green energy
- Utilities for property: None
Community & HOA
Location
- Region: Chicago
Financial & listing details
- Tax assessed value: $9,380
- Annual tax amount: $430
- Date on market: 10/29/2026
- Ownership: Fee Simple
- Road surface type: Concrete
Estimated market value
Not available
Estimated sales range
Not available
Not available
Price history
| Date | Event | Price |
|---|---|---|
| 10/29/2026 | Listing removed | $10,899 |
Source: MRED as distributed by MLS GRID #12666704 Report a problem | ||
| 6/3/2026 | Listed for sale | $10,8990% |
Source:  MRED as distributed by MLS GRID #12666704 Report a problem | ||
| 6/3/2026 | Listing removed | $10,900 |
Source: MRED as distributed by MLS GRID #12647036 Report a problem | ||
| 5/20/2026 | Price change | $10,900 |
Source: REMAX Report a problem | ||
| 5/19/2026 | Price change | -- |
Source: MRED as distributed by MLS GRID #12647036 Report a problem | ||
| 5/13/2026 | Listed for sale | $10,900+45.3% |
Source: MRED as distributed by MLS GRID #12647036 Report a problem | ||
| 9/25/2025 | Listing removed | $7,500 |
Source: MRED as distributed by MLS GRID #12394901 Report a problem | ||
| 9/4/2025 | Listed for sale | $7,500-71.2% |
Source: MRED as distributed by MLS GRID #12394901 Report a problem | ||
| 2/7/2017 | Listing removed | $26,000 |
Source: Inter-City Realty Inc. #09229468 Report a problem | ||
| 5/23/2016 | Price change | $26,000-25.7% |
Source: Inter-City Realty Inc. #09229468 Report a problem | ||
| 5/18/2016 | Listed for sale | $35,000-61.1% |
Source: Inter-City Realty Inc. #09229468 Report a problem | ||
| 6/3/2005 | Sold | $90,000-5.3% |
Source: Public Record Report a problem | ||
| 10/11/2001 | Sold | $95,000+578.6% |
Source: Public Record Report a problem | ||
| 10/23/2000 | Sold | $14,000-39.1% |
Source: Public Record Report a problem | ||
| 1/21/1998 | Sold | $23,000 |
Source: Public Record Report a problem | ||
Public tax history
| Year | Property taxes | Tax assessment |
|---|---|---|
| 2024 | $189 -56.1% | $938 -53.8% |
| 2023 | $431 +2.6% | $2,031 |
| 2022 | $420 +2.9% | $2,031 |
| 2021 | $408 -10.3% | $2,031 |
| 2020 | $455 +10.9% | $2,031 |
| 2019 | $411 +1.7% | $2,031 |
| 2018 | $404 -76.3% | $2,031 -74.2% |
| 2017 | $1,707 +7.5% | $7,878 |
| 2016 | $1,588 +9.2% | $7,878 |
| 2015 | $1,454 +8.3% | $7,878 +9.7% |
| 2014 | $1,343 +2% | $7,181 |
| 2013 | $1,317 +1.3% | $7,181 |
| 2012 | $1,299 -11.6% | $7,181 -20.3% |
| 2011 | $1,470 -0.5% | $9,010 |
| 2010 | $1,477 +4.3% | $9,010 |
| 2009 | $1,416 -12% | $9,010 -19.1% |
| 2008 | $1,609 +0.9% | $11,132 |
| 2007 | $1,594 -1.1% | $11,132 |
| 2006 | $1,611 +69.9% | $11,132 +91.8% |
| 2005 | $948 +0.1% | $5,804 |
| 2004 | $948 +2.2% | $5,804 |
| 2003 | $927 +17.2% | $5,804 +33.1% |
| 2002 | $791 +3.7% | $4,361 |
| 2001 | $763 +34.6% | $4,361 |
| 2000 | $567 | $4,361 +49.3% |
| 1999 | -- | $2,920 |
Find assessor info on the county website
Monthly payment
Climate risks
Neighborhood: Back of the Yards
Nearby schools

Similar homes
- $10,0003,049 sqft5144 S Wolcott Ave, Chicago, IL 60609Active
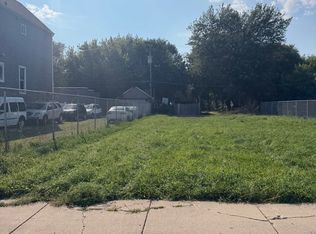 MLS ID #12756302, Don Felton, Chicago's Real Estate Agency. MRED as distributed by MLS GRID
- $10,0002,613 sqft5350 S Peoria St, Chicago, IL 60609Active
 MLS ID #12756249, Don Felton, Chicago's Real Estate Agency. MRED as distributed by MLS GRID
- $14,5000.25 acres7041 S Aberdeen St, Chicago, IL 60621New
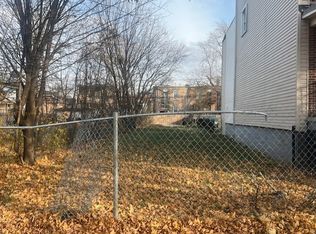 MLS ID #12803909, Michael Daniels, Coldwell Banker Realty. MRED as distributed by MLS GRID
- $10,0003,097 sqft5943 S May St, Chicago, IL 60621Active
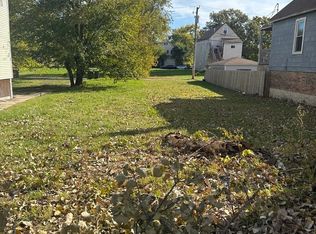 MLS ID #12784054, Aaron Gaines, Keller Williams Preferred Realty. MRED as distributed by MLS GRID
