Excellent investment opportunity! This well-maintained 4-plex at 536 Palomas Dr SE generates $3,900/month in gross rental income. Unit mix includes four 2 bed/1 bath units. Features include off-street parking, private enclosed courtyards, newer windows, and newer stucco. A turnkey addition to any investment portfolio with strong cash flow.532 Palomas Dr SE is also for sale and can be bought together.
Pending
$420,000
536 Palomas Dr SE, Albuquerque, NM 87108
4beds
2baths
3,136sqft
Quadruplex, Multi Family
Built in 1979
-- sqft lot
$-- Zestimate®
$134/sqft
$-- HOA
What's special
Off-street parkingPrivate enclosed courtyardsNewer stuccoNewer windows
- 48 days
- 72
- 0
Zillow last checked:
Listing updated:
Listed by:
Tyler M Pete 505-264-3082,
EXP Realty LLC 505-554-3873,
Joel Aguirre 505-573-2155,
EXP Realty LLC
Source: SWMLS,MLS#: 1110498
Facts & features
Interior
Bedrooms & bathrooms
- Bedrooms: 4
- Bathrooms: 2
Heating
- Forced Air
Cooling
- Evaporative Cooling
Appliances
- Included: Free-Standing Electric Range, Refrigerator
- Laundry: Washer Hookup, Dryer Hookup, In Unit
Features
- Flooring: Tile
Interior area
- Total structure area: 3,136
- Total interior livable area: 3,136 sqft
Property
Features
- Levels: Two
- Stories: 2
Lot
- Size: 6,969 Square Feet
Details
- Parcel number: 101805610847922820
- Zoning description: MX-M*
Construction
Type & style
- Home type: MultiFamily
- Property subtype: Quadruplex, Multi Family
Condition
- Resale
- New construction: No
- Year built: 1979
Utilities & green energy
- Utilities for property: Electricity Connected, Natural Gas Connected, Sewer Connected, Water Connected
Green energy
- Energy generation: None
Community & HOA
Community
- Security: Security Gate
- Subdivision: Of Baron Burg Heights Add
Location
- Region: Albuquerque
Financial & listing details
- Price per square foot: $134/sqft
- Tax assessed value: $255,600
- Annual tax amount: $3,599
- Date on market: 9/5/2026
- Cumulative days on market: 46 days
- Listing terms: Cash,Conventional,FHA,VA Loan
- Total actual rent: 3900
- Tenant pays: Other, See Remarks
Estimated market value
Not available
Estimated sales range
Not available
$1,608/mo
Price history
| Date | Event | Price |
|---|---|---|
| 9/30/2026 | Pending sale | $420,000$134/sqft |
Source:  SWMLS #1110498 Report a problem | ||
| 9/5/2026 | Listed for sale | $420,000$134/sqft |
Source: SWMLS #1110498 Report a problem | ||
| 1/24/2023 | Sold | -- |
Source: Public Record Report a problem | ||
| 1/5/2016 | Listing removed | $525 |
Source: Three Sons Property Management Report a problem | ||
| 11/11/2015 | Listed for rent | $525 |
Source: Three Sons Property Management Report a problem | ||
Public tax history
| Year | Property taxes | Tax assessment |
|---|---|---|
| 2025 | $3,600 -19.4% | $85,192 -19.5% |
| 2024 | $4,466 +40% | $105,856 +41.8% |
| 2023 | $3,191 +3.5% | $74,668 +3% |
| 2022 | $3,083 +33.4% | $72,493 +32.8% |
| 2021 | $2,312 +1.7% | $54,598 +3% |
| 2020 | $2,274 | $53,007 +3% |
| 2019 | -- | $51,464 |
| 2018 | $1,950 -8.4% | $51,464 +3% |
| 2017 | $2,128 +6.2% | $49,965 +6.1% |
| 2016 | $2,004 -95.6% | $47,098 +3% |
| 2015 | $45,726 +2325.6% | $45,726 +3% |
| 2014 | $1,885 | $44,395 +3% |
| 2013 | $1,885 | $43,102 |
| 2012 | -- | $43,102 |
| 2011 | -- | $43,102 -40.2% |
| 2010 | -- | $72,093 +24.9% |
| 2009 | -- | $57,726 +3% |
| 2008 | -- | $56,045 +3% |
| 2007 | -- | $54,413 +3% |
| 2006 | -- | $52,828 +2.2% |
| 2005 | -- | $51,696 |
| 2004 | -- | $51,696 |
| 2003 | -- | $51,696 +3% |
| 2002 | -- | $50,190 +3% |
| 2001 | -- | $48,728 +17.4% |
| 2000 | -- | $41,496 |
Find assessor info on the county website
Monthly payment
Est. payment
Payment breakdown
Explore the cost of this home by adjusting the details. Changes won't be saved.Climate risks
Neighborhood: South San Pedro
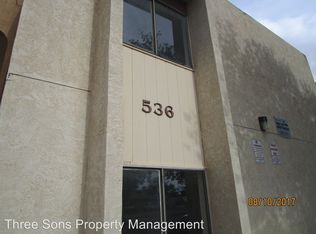
- $--2 bd1 ba700 sqft536 Palomas Dr SE APT D, Albuquerque, NM 87108Off Market
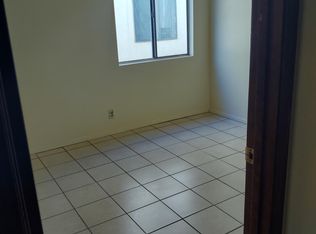
- $--2 bd1 ba800 sqft536 Palomas Dr SE APT B, Albuquerque, NM 87108Off Market
- $--2 bd1 ba800 sqft536 Palomas Dr SE APT C, Albuquerque, NM 87108Off Market
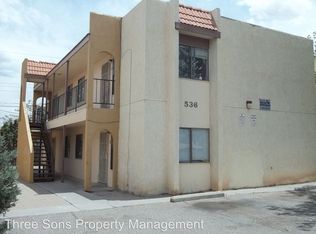
- $294,5002 bd1 ba800 sqft536 Palomas Dr SE APT A, Albuquerque, NM 87108Off Market
Similar homes
- $420,0005 bd3 ba2.4k sqft630 Alcazar St SE, Albuquerque, NM 87108For Sale
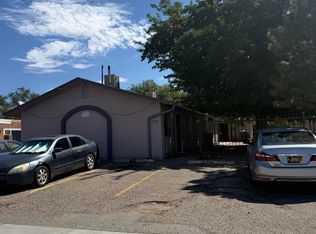 MLS ID #1110555, Tyler M Pete, EXP Realty LLC. SWMLS
- $420,0004 bd4 ba2.5k sqft525 Kentucky St SE, Albuquerque, NM 87108For Sale
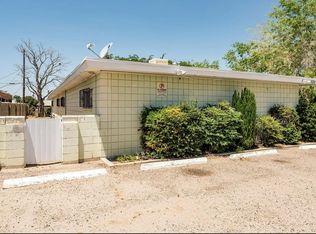 MLS ID #1110539, Tyler M Pete, EXP Realty LLC. SWMLS
- $420,0003 bd2 ba2.4k sqft632 Alcazar St SE, Albuquerque, NM 87108For Sale
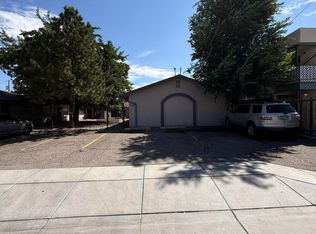 MLS ID #1110499, Tyler M Pete, EXP Realty LLC. SWMLS
- $420,0002 bd2 ba2.5k sqft521 Kentucky St SE, Albuquerque, NM 87108For Sale
 MLS ID #1110540, Tyler M Pete, EXP Realty LLC. SWMLS
