Located in China Gardens with close proximity to downtown, the Draper Preserve, and fishing. This 8200 sq ft lot on the corner of W Chestnut with mature trees feels much larger due to being on the corner. The property is being sold AS IS, WHERE IS. One level home with an attached 1 car garage. No HOA dues
Under contract
$385,000
540 Ivy St, Hailey, ID 83333
3beds
1,008sqft
Single Family Residence
Built in 1974
8,276 Square Feet Lot
$382,800 Zestimate®
$382/sqft
$-- HOA
What's special
One level homeMature trees
- 20 days
- 1,676
- 85
Zillow last checked:
Listing updated:
Listed by:
Stephanie Reed Real Estate 208-720-8958,
Keller Williams Sun Valley Southern Idaho,
Braigen Sorensen
Source: Sun Valley BOR MLS,MLS#: 26-335059
Facts & features
Interior
Bedrooms & bathrooms
- Bedrooms: 3
- Bathrooms: 1
- Full bathrooms: 1
Heating
- Has Heating (Unspecified Type)
Interior area
- Total structure area: 1,008
- Total interior livable area: 1,008 sqft
- Finished area above ground: 1,008
Property
Parking
- Parking features: Garage - Attached
- Has attached garage: Yes
Lot
- Size: 8,276 Square Feet
Details
- Parcel number: RPH04100070040
- Zoning: H/GR
Construction
Type & style
- Home type: SingleFamily
- Property subtype: Single Family Residence
Condition
- New construction: No
- Year built: 1974
Community & HOA
Community
- Subdivision: China Gardens
HOA
- Has HOA: No
Location
- Region: Hailey
Financial & listing details
- Price per square foot: $382/sqft
- Tax assessed value: $480,406
- Annual tax amount: $1,244
- Date on market: 10/29/2026
- Inclusions: true
- Road surface type: Paved
Estimated market value
$382,800
$364,000 - $402,000
$2,925/mo
Price history
| Date | Event | Price |
|---|---|---|
| 11/10/2026 | Contingent | $385,000$382/sqft |
Source:  Sun Valley BOR MLS #26-335059 Report a problem | ||
| 10/29/2026 | Listed for sale | $385,000$382/sqft |
Source: Sun Valley BOR MLS #26-335059 Report a problem | ||
Public tax history
| Year | Property taxes | Tax assessment |
|---|---|---|
| 2025 | $1,244 -8.2% | $355,406 |
| 2024 | $1,356 -4.2% | $355,406 |
| 2023 | $1,415 +28.3% | $355,406 +41.6% |
| 2022 | $1,104 +25.3% | $251,061 +57.7% |
| 2021 | $881 -3% | $159,246 +15.9% |
| 2020 | $908 +15.6% | $137,413 +18.8% |
| 2019 | $785 +11% | $115,695 +49.3% |
| 2017 | $708 | $77,480 |
| 2016 | $708 -2.1% | $77,480 +107.1% |
| 2013 | $723 | $37,408 -28.8% |
| 2012 | -- | $52,551 -23.3% |
| 2011 | -- | $68,528 -54.3% |
| 2010 | -- | $149,896 |
Find assessor info on the county website
Monthly payment
Est. payment
Payment breakdown
Explore the cost of this home by adjusting the details. Changes won't be saved.Climate risks
Neighborhood: 83333

Similar homes
- $415,0002 bd1 ba974 sqftCopper Ranch, Hailey, ID 83333For Sale
 MLS ID #26-334723, Jamie Coulter. Sun Valley BOR MLS
- $425,0001 bd1 ba510 sqft109 Village Way #2019, Sun Valley, ID 83353For Sale By Owner
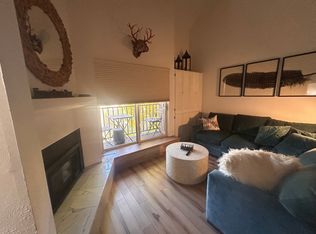
- $450,0001 bd1 ba510 sqftElkhorn Village, The, Sun Valley, ID 83353For Sale
 MLS ID #26-334985, Travis Jones & Svea Grover Jones & Grover Team. Sun Valley BOR MLS
- $575,0002 bd1 ba882 sqftAlpine Villa, Ketchum, ID 83340For Sale
 MLS ID #26-334923, Hausmann & Schroder. Sun Valley BOR MLS
