This 1243 square foot single family home has 3 bedrooms and 2.0 bathrooms. This home is located at 5412 Hillburn Rd, Bakersfield, CA 93306.
Pre-foreclosure
Street View
Est. $299,700
5412 Hillburn Rd, Bakersfield, CA 93306
3beds
2baths
1,243sqft
SingleFamily
Built in 1962
6,534 Square Feet Lot
$299,700 Zestimate®
$241/sqft
$-- HOA
Overview
- 53 days
- 11
- 0
Facts & features
Interior
Bedrooms & bathrooms
- Bedrooms: 3
- Bathrooms: 2
Heating
- Wall
Cooling
- Other
Features
- Has fireplace: Yes
Interior area
- Total interior livable area: 1,243 sqft
Property
Parking
- Parking features: Garage - Attached
Lot
- Size: 6,534 Square Feet
Details
- Parcel number: 13436513
Construction
Type & style
- Home type: SingleFamily
Materials
- wood frame
Condition
- Year built: 1962
Community & HOA
Location
- Region: Bakersfield
Financial & listing details
- Price per square foot: $241/sqft
- Tax assessed value: $275,000
Foreclosure details
Estimated market value
$299,700
$276,000 - $321,000
$1,993/mo
Price history
| Date | Event | Price |
|---|---|---|
| 11/17/2006 | Sold | $249,000+251.2%$200/sqft |
Source: Public Record Report a problem | ||
| 10/31/1996 | Sold | $70,909$57/sqft |
Source: Public Record Report a problem | ||
Public tax history
| Year | Property taxes | Tax assessment |
|---|---|---|
| 2026 | -- | $275,000 +1.5% |
| 2025 | $3,963 +1.4% | $271,000 +1.9% |
| 2024 | $3,910 -0.9% | $266,000 -1.8% |
| 2023 | $3,944 +12.4% | $271,000 +13.9% |
| 2022 | $3,508 | $238,000 +13.9% |
| 2021 | -- | $209,000 +25.1% |
| 2020 | $2,575 +1.4% | $167,000 +1.2% |
| 2019 | $2,540 +12.8% | $165,000 +14.6% |
| 2018 | $2,252 +1.5% | $144,000 +2.9% |
| 2017 | $2,220 +13.9% | $140,000 +8.5% |
| 2016 | $1,949 +0.9% | $129,000 +2.4% |
| 2015 | $1,932 +4.4% | $126,000 +4.1% |
| 2014 | $1,850 | $121,000 +72.9% |
| 2013 | -- | $70,000 -17.6% |
| 2012 | $1,455 +1.8% | $85,000 |
| 2011 | $1,430 +3.2% | $85,000 +2.9% |
| 2010 | $1,385 -0.7% | $82,571 -0.6% |
| 2009 | $1,395 -44.7% | $83,109 -54.8% |
| 2008 | $2,523 -23% | $184,056 -26.1% |
| 2007 | $3,278 +145.8% | $249,000 +194.3% |
| 2006 | $1,334 +1.9% | $84,610 +2% |
| 2005 | $1,309 +1.3% | $82,951 |
| 2004 | $1,293 +4.6% | $82,951 +1.9% |
| 2003 | $1,235 | $81,432 +4% |
| 2002 | $1,235 +4.3% | $78,272 +2% |
| 2001 | $1,185 | $76,738 |
| 2000 | -- | $76,738 |
Find assessor info on the county website
Monthly payment
Climate risks
Neighborhood: East Niles

Similar homes
- $290,0003 bd2 ba1.3k sqft2818 Wenatchee Ave, Bakersfield, CA 93306For Sale
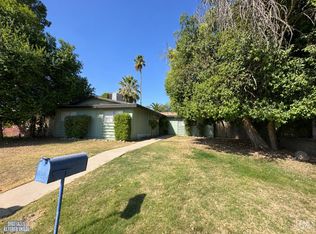 MLS ID #202611975, Eric Mora. Bakersfield AOR
- $289,9993 bd1 ba1.1k sqft1321 Vale St, Bakersfield, CA 93306For Sale
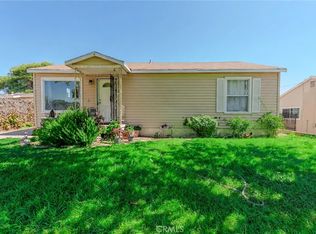 MLS ID #SR26198957, David Machado, Luxury Collective. CRMLS
- $329,9003 bd2 ba1.3k sqft2711 Clemson Ct, Bakersfield, CA 93306For Sale
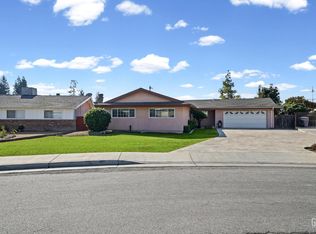 MLS ID #202611560, Jose L. Perez. Bakersfield AOR
- $299,9003 bd2 ba1.5k sqft2724 Valencia Dr, Bakersfield, CA 93306For Sale
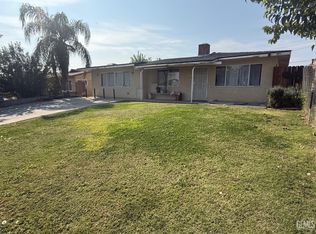 MLS ID #202610931, Rolando Gonzales. Bakersfield AOR
