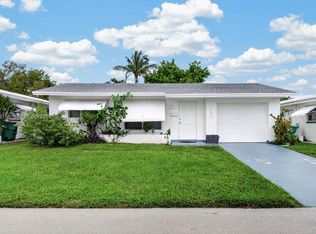
Single Family home priced to sell quickly. In a 55+ community with no credit requirement (as of now). Beautiful Corner Lot with Florida room.
For sale
$280,000
5415 NW 49th Ter, Tamarac, FL 33319
2beds
1,579sqft
Single Family Residence
Built in 1969
6,053 Square Feet Lot
$-- Zestimate®
$177/sqft
$90/mo HOA
What's special
Florida roomBeautiful corner lot
- 15 days
- 629
- 41
Likely to sell faster than
Zillow last checked:
Listing updated:
Listed by:
Rashad Taylor 954-801-4673,
Florida Capital Realty
Source: MIAMI,MLS#: A12112175 Originating MLS: A-Miami Association of REALTORS
Facts & features
Interior
Bedrooms & bathrooms
- Bedrooms: 2
- Bathrooms: 2
- Full bathrooms: 2
Rooms
- Room types: Florida Room
Heating
- Central, Electric
Cooling
- Central Air
Appliances
- Included: Dishwasher
Features
- Flooring: Tile
Interior area
- Total structure area: 1,947
- Total interior livable area: 1,579 sqft
Video & virtual tour
Property
Parking
- Total spaces: 1
- Parking features: Driveway
- Garage spaces: 1
- Has uncovered spaces: Yes
Features
- Stories: 1
- Entry location: First Floor Entry
- Patio & porch: Awning(s)
- Pool features: R30-No Pool/No Water
- Has view: Yes
- View description: Garden
Lot
- Size: 6,053 Square Feet
- Features: Less Than 1/4 Acre Lot
Details
- Parcel number: 494113102180
- Zoning: R-1
Construction
Type & style
- Home type: SingleFamily
- Property subtype: Single Family Residence
Materials
- Concrete Block Construction
- Roof: Bahama
Condition
- Year built: 1969
Utilities & green energy
- Electric: Circuit Breakers
- Sewer: Public Sewer
- Water: Municipal Water
Community & HOA
Community
- Features: HOA
- Senior community: Yes
- Subdivision: Mainlands Of Tamarac Lake
HOA
- Has HOA: Yes
- HOA fee: $90 monthly
Location
- Region: Tamarac
Financial & listing details
- Price per square foot: $177/sqft
- Tax assessed value: $319,260
- Annual tax amount: $4,852
- Date on market: 10/23/2026
- Listing terms: All Cash,Conventional,FHA
Foreclosure details
Estimated market value
Not available
Estimated sales range
Not available
Not available
Price history
| Date | Event | Price |
|---|---|---|
| 10/26/2026 | Listed for sale | $280,000+33.7%$177/sqft |
Source:  MIAMI #A12112175 Report a problem | ||
| 10/10/2019 | Sold | $209,500-0.2%$133/sqft |
Source:  BeachesMLS #F10182699 Report a problem | ||
| 8/25/2019 | Price change | $210,000-8.7%$133/sqft |
Source: United Realty Group, Inc #F10182699 Report a problem | ||
| 8/20/2019 | Price change | $230,000-3.8%$146/sqft |
Source: United Realty Group, Inc #F10182699 Report a problem | ||
| 7/24/2019 | Price change | $239,000-4%$151/sqft |
Source: United Realty Group, Inc #F10182699 Report a problem | ||
| 6/27/2019 | Listed for sale | $249,000+71.7%$158/sqft |
Source: United Realty Group, Inc #F10182699 Report a problem | ||
| 7/22/2016 | Sold | $145,000-9.2%$92/sqft |
Source: Public Record Report a problem | ||
| 6/19/2016 | Pending sale | $159,777$101/sqft |
Source: RE/MAX In Motion Inc #F10015569 Report a problem | ||
| 6/8/2016 | Listed for sale | $159,777+1764.2%$101/sqft |
Source: RE/MAX In Motion Inc #F10015569 Report a problem | ||
| 8/1/1991 | Sold | $8,571$5/sqft |
Source: Public Record Report a problem | ||
Public tax history
| Year | Property taxes | Tax assessment |
|---|---|---|
| 2025 | $4,852 +3.2% | $230,170 +2.9% |
| 2024 | $4,703 +2.1% | $223,690 +3% |
| 2023 | $4,606 +6.3% | $217,180 +3% |
| 2022 | $4,334 +2.3% | $210,860 +3% |
| 2021 | $4,239 +1.5% | $204,720 +1.4% |
| 2020 | $4,177 +0.6% | $201,900 +30.2% |
| 2019 | $4,154 -28.2% | $155,040 +10% |
| 2018 | $5,785 +7.4% | $140,950 +6.8% |
| 2017 | $5,385 +3% | $131,950 +23.9% |
| 2016 | $5,226 +61.4% | $106,480 +10% |
| 2015 | $3,239 +18.5% | $96,800 +10% |
| 2014 | $2,733 | $88,000 +7.6% |
| 2013 | $2,733 +22.7% | $81,820 +12.5% |
| 2012 | $2,228 +19.2% | $72,730 +2.4% |
| 2011 | $1,869 +3.4% | $71,040 +0.3% |
| 2010 | $1,807 -32.1% | $70,860 -37.8% |
| 2009 | $2,663 -21.5% | $113,870 -25.7% |
| 2008 | $3,391 -21% | $153,300 -23.6% |
| 2007 | $4,292 -10% | $200,660 +0.8% |
| 2006 | $4,771 | $199,020 +39% |
| 2005 | -- | $143,210 +27.9% |
| 2004 | $2,962 +12.2% | $111,940 +13.9% |
| 2003 | $2,639 +18.5% | $98,320 +19.3% |
| 2002 | $2,227 +11.9% | $82,430 +12% |
| 2001 | $1,990 +9.5% | $73,620 |
| 2000 | $1,818 | -- |
Find assessor info on the county website
Monthly payment
Est. payment
Payment breakdown
Explore the cost of this home by adjusting the details. Changes won't be saved.Climate risks
Neighborhood: 33319
Nearby schools
Schools provided by the listing agent
- Elementary: Pinewood
- Middle: Silver Lks Middle
- High: Boyd H Anderson
Source: MIAMI. This data may not be complete. We recommend contacting the local school district to confirm school assignments for this home.
Similar homes
- $294,9002 bd1 ba1k sqftMainlands Of Tamarac Lake, Fort Lauderdale, FL 33319For Sale
 MLS ID #A12109158, Johnny Rivera, STB Realty. MIAMI
- $289,9003 bd3 ba1.4k sqftShaker Village Phase 1, Tamarac, FL 33319For SaleMLS ID #A12121077, Paul Lameiro, MetroMiami Realty LLC. MIAMI
- $254,9002 bd1 ba1k sqft5309 NW 49TH Avenue, Tamarac, FL 33319For Sale

 MLS ID #B26093626, Tristan Beavers, T3 Realty, LLC. BeachesMLS
- $299,0002 bd2 ba1.5k sqft4517 NW 49th Court, Tamarac, FL 33319For Sale
 MLS ID #B26050955, Leonardo Alvarado, My Florida Bella Property Inc. BeachesMLS
- $299,0002 bd2 ba1.1k sqftMainlands Of Tamarac Lake, Tamarac, FL 33319For SaleMLS ID #A12082732, Maritza Sanchez-Lagomarcino, United Realty Group Inc.. MIAMI
- $339,0002 bd2 ba1.5k sqftOakland Estates 1st Sec, Lauderdale Lakes, FL 33319For SaleMLS ID #A12120506, Marcelo Olsak, Florida Brokers Real Estate. MIAMI
- $274,9992 bd1 ba1k sqft4708 NW 49th Drive, Tamarac, FL 33319For SaleMLS ID #B26001908, Maria Consuelo Celis, Charles Rutenberg Realty FTL. BeachesMLS
- $229,0002 bd1 ba1k sqft4935 NW 47TH Terrace, Tamarac, FL 33319For SaleMLS ID #B26096565, Evelyn D Reibel, Keyes Company. BeachesMLS
- $240,0002 bd1 ba1.1k sqftMainlands Of Tamarac Lake, Tamarac, FL 33319For SaleMLS ID #A12088782, Yumiko Ray, Jason Mitchell Real Estate Flo. MIAMI
- $310,0002 bd2 ba1.2k sqftMainlands Of Tamarac Lake, Tamarac, FL 33319For SaleMLS ID #A12098481, Patrick Robinson, Compass Florida, LLC. MIAMI
- $274,9992 bd1 ba1k sqft4511 NW 45TH Court, Tamarac, FL 33319For SaleMLS ID #B26059496, Walner Decius, United Realty Group Inc.. BeachesMLS
- $338,0002 bd2 ba1.7k sqft4911 NW 55th Street, Tamarac, FL 33319For SaleMLS ID #B26041463, Dante DePanicis, LoKation. BeachesMLS
- $249,1002 bd1 ba806 sqftMainlands Of Tamarac Lake, Tamarac, FL 33319AuctionMLS ID #A12117372, Andrea Butcher, Realhome Service & Solutions I. MIAMI
- $315,0002 bd2 ba1.2k sqft4405 NW 48th Avenue, Tamarac, FL 33319For SaleMLS ID #B26068474, Karen Christine Negron, Fathom Realty FL, LLC. BeachesMLS
- $265,0002 bd1 ba1k sqft4401 NW 47th Street, Tamarac, FL 33319For SaleMLS ID #B26024635, Marlene Omphroy, Charles Rutenberg Realty FTL. BeachesMLS
- $407,0002 bd2 ba1.2k sqft4706 NW 49TH Drive, Tamarac, FL 33319For SaleMLS ID #B26095046, Keisha Weir, United Realty Group Inc.. BeachesMLS
- $280,0004 bd3 ba1.8k sqftShaker Village, Fort Lauderdale, FL 33319For SaleMLS ID #A12112155, Karen Albright, Opendoor Brokerage LLC. MIAMI
- $359,9002 bd2 ba1k sqftMainlands Of Tamarac Lake, Tamarac, FL 33319For SaleMLS ID #A12102111, Marcela Ramponi, Avanti Way Premiere. MIAMI
- $255,0002 bd1 ba1k sqft4503 NW 47TH Court, Tamarac, FL 33319For SaleMLS ID #B26053380, Sue Ann Harry, Fidelity Real Estate LLC. BeachesMLS
- $299,7502 bd1 ba806 sqftMainlands Of Tamarac Lake, Tamarac, FL 33319For SaleMLS ID #A12073470, Alexandra DuPont, Dupont International Realty. MIAMI
