the2nd and 3rd floors. The total square feet of all units = 2800 ++
The triplex sits on a large well kep lot encompassing approximately a half acre! It is a solid structure - no sagging or slanting floors here! When you walk in - you know you're in a solidly contructed building that was built on block pillars sitting on a concrete slab.
* Updated electric
* Updated plumbing
* Updated iron fire escape
* Roof is in good shape
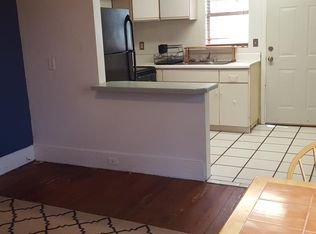
* Includes ALL appliances
* All NEW (Ductless mini - split inverter a/c -heat pump systems. (For each unit)
Convenient to everything - minutes from Daytona Beach.
Close to 4 colleges including Embry-Riddle, Bethune Cookman, & Daytona State (GREAT RENTAL MARKET)
A nice street near much development including a large
multi unit building for near by college.
Gross income = $2000.00 dollars per month - $700.00 dollars in expenses
$1300.00 NOI x 12 = $15,600.00 x 10% cap = $156,000.00
THIS IS A CASH ONLY DEAL - Must be able to close quickly
$95,000
For additional information - please call 386-265-9986
Pre-foreclosure
Est. $348,400
549 Magnolia Ave, Daytona Beach, FL 32114
8beds
2,864sqft
MultiFamily
Built in 1926
-- sqft lot
$348,400 Zestimate®
$122/sqft
$-- HOA
Overview
- 182 days
- 31
- 1
Facts & features
Interior
Bedrooms & bathrooms
- Bedrooms: 8
- Bathrooms: 4
- Full bathrooms: 3
- 1/2 bathrooms: 1
Heating
- Heat pump, Electric
Cooling
- Central
Features
- Flooring: Carpet
- Has fireplace: No
Interior area
- Total interior livable area: 2,864 sqft
Property
Parking
- Parking features: Carport, Off-street
Features
- Exterior features: Other, Shingle, Wood
Lot
- Size: 6,215 Square Feet
Details
- Parcel number: 533926000110
Construction
Type & style
- Home type: MultiFamily
Materials
- wood frame
- Foundation: Wood
- Roof: Asphalt
Condition
- Year built: 1926
Community & HOA
Location
- Region: Daytona Beach
Financial & listing details
- Price per square foot: $122/sqft
- Tax assessed value: $271,042
- Annual tax amount: $4,439
Foreclosure details
Estimated market value
$348,400
$307,000 - $390,000
$1,460/mo
Price history
| Date | Event | Price |
|---|---|---|
| 6/2/2022 | Sold | $329,900$115/sqft |
Source:  DBAMLS #1095725 Report a problem | ||
| 4/22/2022 | Contingent | $329,900$115/sqft |
Source: DBAMLS #1095725 Report a problem | ||
| 4/21/2022 | Listed for sale | $329,900+179.6%$115/sqft |
Source: DBAMLS #1095725 Report a problem | ||
| 3/24/2021 | Listing removed | -- |
Source: Owner Report a problem | ||
| 3/8/2017 | Sold | $118,000+57.3%$41/sqft |
Source: DBAMLS #1021926 Report a problem | ||
| 8/15/2016 | Sold | $75,000-11.8%$26/sqft |
Source: Public Record Report a problem | ||
| 7/6/2016 | Price change | $85,000-10.5%$30/sqft |
Source: Owner Report a problem | ||
| 6/27/2016 | Listed for sale | $95,000+400%$33/sqft |
Source: Owner Report a problem | ||
| 4/29/2011 | Sold | $19,000-34.3%$7/sqft |
Source: Public Record Report a problem | ||
| 3/24/2011 | Price change | $28,900-11.8%$10/sqft |
Source: Listhub #516128 Report a problem | ||
| 2/11/2011 | Listed for sale | $32,750-17.9%$11/sqft |
Source: Listhub #513588 Report a problem | ||
| 12/18/2010 | Listing removed | $39,900$14/sqft |
Source: Exit Realty Central Report a problem | ||
| 11/10/2010 | Listed for sale | $39,900-46.8%$14/sqft |
Source: Exit Realty Central Report a problem | ||
| 4/8/2003 | Sold | $75,000-65.1%$26/sqft |
Source: Public Record Report a problem | ||
| 1/19/1996 | Sold | $215,000+101.9%$75/sqft |
Source: Public Record Report a problem | ||
| 6/7/1995 | Sold | $106,500+326%$37/sqft |
Source: Public Record Report a problem | ||
| 12/1/1994 | Sold | $25,000$9/sqft |
Source: Public Record Report a problem | ||
Public tax history
| Year | Property taxes | Tax assessment |
|---|---|---|
| 2025 | $4,439 +9.6% | $259,112 +21% |
| 2024 | $4,051 +16.1% | $214,143 +10% |
| 2023 | $3,490 +36.3% | $194,675 +54.1% |
| 2022 | $2,560 | $126,315 +10% |
| 2021 | -- | $114,832 +8.1% |
| 2020 | $2,056 | $106,238 +3% |
| 2019 | $2,056 +3.7% | $103,111 +13.6% |
| 2018 | $1,983 +7.3% | $90,746 +30.7% |
| 2017 | $1,848 +25.5% | $69,420 +415.1% |
| 2016 | $1,472 +392.4% | $13,476 +10.6% |
| 2015 | $299 -59.8% | $12,188 -61.4% |
| 2014 | $745 | $31,566 +6.5% |
| 2013 | -- | $29,628 -1.1% |
| 2012 | -- | $29,948 -6% |
| 2011 | -- | $31,870 -20.4% |
| 2010 | -- | $40,027 -10.9% |
| 2009 | -- | $44,930 -17.5% |
| 2007 | -- | $54,447 -10.8% |
| 2006 | -- | $61,024 +35.4% |
| 2005 | -- | $45,056 +31.4% |
| 2004 | -- | $34,277 +34.4% |
| 2003 | -- | $25,503 +9.5% |
| 2002 | -- | $23,282 +11.5% |
| 2001 | -- | $20,880 -15.3% |
| 2000 | -- | $24,649 |
Find assessor info on the county website
Monthly payment
Climate risks
Neighborhood: 32114
Similar homes
- $429,9007 bd4 ba2.5k sqft213/215 Live Oak Ave, Daytona Beach, FL 32114For Sale
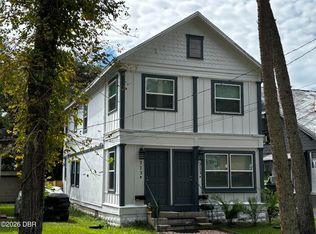
 MLS ID #1231010, Chad T Shultz, Adams, Cameron & Co., Realtors. DBAMLS
- $334,9008 bd4 ba2.5k sqft415 VERMONT AVENUE, DAYTONA BEACH, FL 32118For Sale
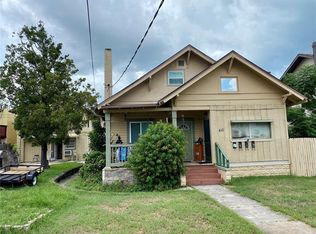
 MLS ID #O6419103, Matt White, SLOANE REALTY, LLC. Stellar MLS
- $510,9935 bd4 ba2.1k sqft532 Magnolia Ave, Daytona Beach, FL 32114For Sale
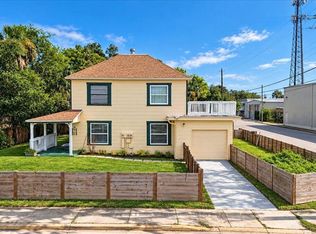 MLS ID #1231493, Cheryl Gray, Oceans Luxury Realty Full Service LLC. DBAMLS
- $299,9006 bd2 ba1.8k sqft341 FAIRVIEW AVENUE, DAYTONA BEACH, FL 32114For Sale
 MLS ID #O6444624, Michael Aversano, ONE KEY REALTY. Stellar MLS
- $299,9006 bd2 ba1.8k sqft341 Fairview Ave Unit 2, Daytona Beach, FL 32114For SaleMLS ID #1231141, Michael Aversano, One Key Realty. DBAMLS
- $500,0007 bd3 ba2.5k sqft314 UNIVERSITY BOULEVARD, DAYTONA BEACH, FL 32118For SaleMLS ID #O6451251, Jean Louis, COLDWELL BANKER REALTY. Stellar MLS
- $449,9006 bd4 ba2.1k sqft205 Shady Pl, Daytona Beach, FL 32114For SaleMLS ID #1231704, Nathaniel Ingram, Compass Florida, LLC. DBAMLS
- $399,0005 bd2 ba2.1k sqft722 N Halifax Ave, Daytona Beach, FL 32118For SaleMLS ID #1226017, Doug Gernert, RE/MAX Signature. DBAMLS
- $520,0005 bd4 ba2.3k sqft416 N Peninsula Dr, Daytona Beach, FL 32118For SaleMLS ID #1231390, Brittany Paige Maher, Local Living Realty Group. DBAMLS
- $285,0005 bd3 ba2k sqft1051 June Ter, Daytona Beach, FL 32119For SaleMLS ID #1225657, Tammy Shaver, Redfin Corporation. DBAMLS
- $499,0006 bd6 ba3.3k sqft814 N Halifax Ave, Daytona Beach, FL 32118For SaleMLS ID #1228589, David Levy, Matok Realty & Management Inc. DBAMLS
- $499,0006 bd6 ba3.3k sqft818 N Halifax Ave, Daytona Beach, FL 32118For SaleMLS ID #1228590, David Levy, Matok Realty & Management Inc. DBAMLS
- $450,0005 bd3 ba2.6k sqft2314 S Peninsula Dr, Daytona Beach, FL 32118New ConstructionMLS ID #1229985, Nicole Schlaffer, RE/MAX Signature. DBAMLS
- $277,0006 bd2 ba2k sqft507 PHOENIX AVENUE, DAYTONA BEACH, FL 32118AuctionMLS ID #O6438594, Andrea Butcher, REALHOME SERVICE & SOLUTIONS INC. Stellar MLS
- $449,0005 bd4 ba2.2k sqft2005 Schulte Ave, Daytona Beach, FL 32118For SaleMLS ID #1225917, Eric Zimmerman, RE/MAX FloRealty. DBAMLS
- $440,0006 bd4 ba2.2k sqft1131-1133 Squirrel Nest Ln, Port Orange, FL 32129For SaleMLS ID #1230382, Kelli Patton, Keller Williams Realty Florida Partners. DBAMLS
- $399,9975 bd3 ba2.4k sqft1041 Commons Way, Port Orange, FL 32129New ConstructionDBAMLS
- $498,0005 bd2 ba2.2k sqft1711 Ocean Dunes Ter, Daytona Beach, FL 32118For SaleMLS ID #1223065, Richard Merlino, Liberty Group Realty, Inc.. DBAMLS
- $399,9775 bd3 ba2k sqft1017 Champion Ridge Dr, Daytona Beach, FL 32124New ConstructionDBAMLS
- $397,4705 bd3 ba2.4k sqft906 BLUET DRIVE, PORT ORANGE, FL 32129New ConstructionMLS ID #O6452382, Stephen Cline, DR HORTON REALTY OF CENTRAL FLORIDA LLC. Stellar MLS
