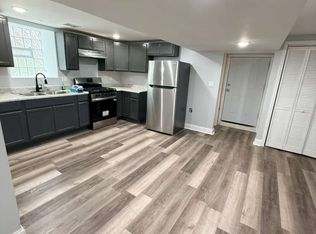
REHABBED 2 FLAT WITH FULL BASEMENT! IN-UNIT LAUNDRY PER UNIT! NEWER HVAC, FLOORING, KITCHEN & BATHS, WINDOWS AND MUCH MORE, MAKES GREAT INVESTMENT PROPERTY OR LIVE IN. Drive by only. Sold as is. No survey provided.
Active
Price cut: $9K (10/8)
$79,000
5610 S Throop St, Chicago, IL 60636
6beds
--sqft
Multi Family
Built in 1898
-- sqft lot
$-- Zestimate®
$--/sqft
$-- HOA
What's special
In-unit laundry per unitNewer hvac
- 40 days
- 504
- 45
Zillow last checked:
Listing updated:
Listed by:
David Williamson 847-912-1592,
Choice Realty Group Inc.
Source: MRED as distributed by MLS GRID,MLS#: 12754138
Facts & features
Interior
Bedrooms & bathrooms
- Bedrooms: 6
- Bathrooms: 2
- Full bathrooms: 2
Heating
- Natural Gas
Features
- Basement: Exterior Entry,Full
Property
Lot
- Size: 3,125 Square Feet
- Dimensions: 25X125
Details
- Parcel number: 20171130270000
- Special conditions: None
Construction
Type & style
- Home type: MultiFamily
- Property subtype: Multi Family
Materials
- Vinyl Siding
Condition
- New construction: No
- Year built: 1898
- Major remodel year: 2015
Utilities & green energy
- Sewer: Public Sewer
- Water: Lake Michigan
Community & HOA
Location
- Region: Chicago
Financial & listing details
- Tax assessed value: $150,010
- Annual tax amount: $844
- Date on market: 9/9/2026
- Ownership: Fee Simple
Estimated market value
Not available
Estimated sales range
Not available
$1,715/mo
Price history
| Date | Event | Price |
|---|---|---|
| 10/8/2026 | Price change | $79,000-10.2% |
Source:  MRED as distributed by MLS GRID #12754138 Report a problem | ||
| 10/1/2026 | Price change | $88,000-1.1% |
Source: MRED as distributed by MLS GRID #12754138 Report a problem | ||
| 9/18/2026 | Price change | $89,000-1% |
Source: MRED as distributed by MLS GRID #12754138 Report a problem | ||
| 9/9/2026 | Listed for sale | $89,900+30.3% |
Source: MRED as distributed by MLS GRID #12754138 Report a problem | ||
| 7/26/2019 | Sold | $69,000-8% |
Source: MRED as distributed by MLS GRID #10339884 Report a problem | ||
| 6/14/2019 | Pending sale | $75,000 |
Source: Keller Williams Elite #10339884 Report a problem | ||
| 3/21/2019 | Price change | $75,000-16.7% |
Source: Real People Realty Inc. #10014426 Report a problem | ||
| 3/12/2019 | Listed for sale | $90,000 |
Source: Real People Realty Inc. #10014426 Report a problem | ||
| 2/28/2019 | Pending sale | $90,000 |
Source: Real People Realty Inc. #10014426 Report a problem | ||
| 12/3/2018 | Price change | $90,000-12.6% |
Source: Real People Realty Inc. #10014426 Report a problem | ||
| 8/22/2018 | Price change | $103,000-16.6% |
Source: Real People Realty Inc. #10014426 Report a problem | ||
| 7/11/2018 | Listed for sale | $123,500-8.5% |
Source: Real People Realty Inc. #10014426 Report a problem | ||
| 10/10/2015 | Listing removed | $135,000 |
Source: RE/MAX 1st Service #08949449 Report a problem | ||
| 7/8/2015 | Price change | $135,000-14% |
Source: RE/MAX 1st Service #08949449 Report a problem | ||
| 6/10/2015 | Price change | $157,000-1.3% |
Source: RE/MAX 1st Service #08949449 Report a problem | ||
| 4/15/2015 | Price change | $159,000-7.6% |
Source: RE/MAX 1st Service #08830341 Report a problem | ||
| 3/27/2015 | Price change | $172,000-5.5% |
Source: RE/MAX 1st Service-IL RMNI #08830341 Report a problem | ||
| 2/6/2015 | Listed for sale | $182,000+1248.1% |
Source: RE/MAX 1st Service RMNI #08830341 Report a problem | ||
| 7/29/2013 | Sold | $13,500-88.1% |
Source: MRED as distributed by MLS GRID #08362803 Report a problem | ||
| 10/9/2007 | Sold | $113,000-19.3% |
Source: Public Record Report a problem | ||
| 5/12/2005 | Sold | $140,000 |
Source: Public Record Report a problem | ||
Public tax history
| Year | Property taxes | Tax assessment |
|---|---|---|
| 2024 | $3,014 +257.2% | $15,001 +275.1% |
| 2023 | $844 +2.6% | $3,999 |
| 2022 | $823 +2.3% | $3,999 |
| 2021 | $804 -53.1% | $3,999 -48% |
| 2020 | $1,714 -3.5% | $7,696 -13% |
| 2019 | $1,777 +1.7% | $8,847 |
| 2018 | $1,748 -40.2% | $8,847 -34.9% |
| 2017 | $2,923 +7.5% | $13,580 |
| 2016 | $2,720 +9.3% | $13,580 |
| 2015 | $2,488 -8% | $13,580 -6.9% |
| 2014 | $2,705 +2% | $14,581 |
| 2013 | $2,652 +1.4% | $14,581 |
| 2012 | $2,616 -15.1% | $14,581 -23.4% |
| 2011 | $3,083 -0.4% | $19,024 |
| 2010 | $3,096 +4.4% | $19,024 |
| 2009 | $2,967 +47.7% | $19,024 +35.9% |
| 2008 | $2,008 +1% | $14,000 |
| 2007 | $1,988 -31.6% | $14,000 -30.9% |
| 2006 | $2,909 +129.5% | $20,264 +161.2% |
| 2005 | $1,268 +1% | $7,758 |
| 2004 | $1,255 +2.2% | $7,758 |
| 2003 | $1,228 +25.4% | $7,758 +42.3% |
| 2002 | $979 +20% | $5,451 |
| 2001 | $816 +157.3% | $5,451 |
| 2000 | $317 +0% | $5,451 +54.7% |
| 1999 | $317 | $3,523 |
Find assessor info on the county website
Monthly payment
Est. payment
Payment breakdown
Explore the cost of this home by adjusting the details. Changes won't be saved.Climate risks
Neighborhood: Englewood
Nearby schools

Similar homes
- $--4 bd2 ba-- sqft6336 S Ada St, Chicago, IL 60636Auction
 MLS ID #12751017, Michael Olszewski, Area Wide Realty. MRED as distributed by MLS GRID
- $--3 bd1 ba1.5k sqft5738 S Ada St, Chicago, IL 60636Auction
 MLS ID #12756651, Grazyna Przybysz, Chicago Area Realty Inc. MRED as distributed by MLS GRID
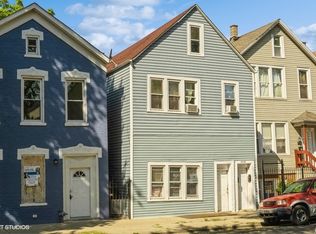
- $79,9957 bd4 ba-- sqft4742 S Loomis Blvd, Chicago, IL 60609Active
 MLS ID #12595886, Dan Ortiz, Baird & Warner. MRED as distributed by MLS GRID
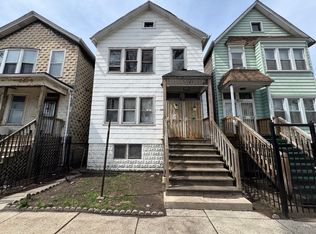
- $90,0005 bd2 ba-- sqft5556 S Princeton Ave, Chicago, IL 60621Active
 MLS ID #12682418, Anthony Disano, Parkvue Realty Corporation. MRED as distributed by MLS GRID
