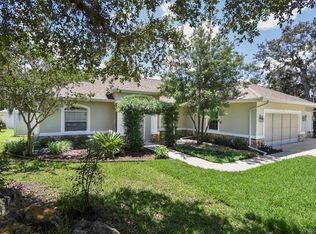
Short Sale MODEL HOME, OVERSIZED CORNER LOT, 9'6" CEILINGS
This property is off market, which means it's not currently listed for sale or rent on Zillow. This may be different from what's available on other websites or public sources.
$581,900
$483,000 - $692,000
$4,693/mo
$4,693/mo
Rent Zestimate®
Find your next renter with Zillow Rental Manager. Plus, with online applications, you can quickly screen prospective tenants – for free.
$4,693/mo
Rent Zestimate®
$3,815/mo
Est. payment
Refinancing to a lower rate could help reduce your monthly payments and save thousands over the life of the loan.
$3,815/mo
Est. payment
Work with a Zillow partner agent
Leverage their expertise and Zillow's premium Showcase listings to get your home seen by more buyers.
Get startedList with your own agent
Get your home in front of millions of buyers by listing it on Zillow.
Learn how to do itSell it yourself
Take full control of how buyers see your home on Zillow by listing For Sale by Owner (FSBO).
List your homeShort Sale MODEL HOME, OVERSIZED CORNER LOT, 9'6" CEILINGS
This property is off market, which means it's not currently listed for sale or rent on Zillow. This may be different from what's available on other websites or public sources.
| Date | Event | Price |
|---|---|---|
| 12/1/2011 | Listing removed | $195,900+39.9%$61/sqft |
Source: RE/MAX ACR ELITE GROUP #T2448109 Report a problem | ||
| 4/11/2011 | Sold | $140,000-28.5%$44/sqft |
Source: Public Record Report a problem | ||
| 5/1/2010 | Price change | $195,900+5.4%$61/sqft |
Source: Henry Dingus Jr. Real Estate / MLS #340568 Report a problem | ||
| 3/25/2010 | Listed for sale | $185,900-43.6%$58/sqft |
Source: Henry Dingus Jr. Real Estate / MLS #340568 Report a problem | ||
| 1/13/2009 | Listing removed | $329,900$103/sqft |
Source: NCI #P664822 Report a problem | ||
| 10/23/2008 | Price change | $329,900-5.7%$103/sqft |
Source: NCI #P664822 Report a problem | ||
| 10/20/2008 | Price change | $349,990+52.2%$109/sqft |
Source: NCI #P664822 Report a problem | ||
| 10/17/2008 | Listed for sale | $229,900-30.3%$72/sqft |
Source: NCI #P664822 Report a problem | ||
| 8/27/2008 | Listing removed | $329,900$103/sqft |
Source: NCI #P664822 Report a problem | ||
| 8/11/2008 | Price change | $329,900+43.5%$103/sqft |
Source: NCI #P664822 Report a problem | ||
| 8/7/2008 | Price change | $229,900-30.3%$72/sqft |
Source: NCI #P664822 Report a problem | ||
| 7/7/2008 | Price change | $329,900-5.7%$103/sqft |
Source: NCI #P664822 Report a problem | ||
| 7/6/2008 | Price change | $349,990+52.2%$109/sqft |
Source: NCI #P664822 Report a problem | ||
| 6/12/2008 | Price change | $229,900-30.3%$72/sqft |
Source: NCI #P664820 Report a problem | ||
| 6/11/2008 | Price change | $329,900-5.7%$103/sqft |
Source: NCI #P664820 Report a problem | ||
| 6/10/2008 | Price change | $349,990+52.2%$109/sqft |
Source: NCI #P664820 Report a problem | ||
| 6/9/2008 | Price change | $229,900-30.3%$72/sqft |
Source: NCI #P664820 Report a problem | ||
| 6/7/2008 | Price change | $329,900-5.7%$103/sqft |
Source: NCI #P664820 Report a problem | ||
| 5/31/2008 | Price change | $349,990+6.1%$109/sqft |
Source: NCI #P664820 Report a problem | ||
| 5/16/2008 | Price change | $329,900-5.7%$103/sqft |
Source: NCI #P664820 Report a problem | ||
| 5/15/2008 | Price change | $349,990+52.2%$109/sqft |
Source: NCI #P664820 Report a problem | ||
| 5/10/2008 | Listed for sale | $229,900-49.5%$72/sqft |
Source: NCI #P664820 Report a problem | ||
| 2/27/2008 | Listing removed | $455,500$142/sqft |
Source: NCI #Basil Report a problem | ||
| 2/21/2008 | Price change | $455,500+13.3%$142/sqft |
Source: NCI #Basil Report a problem | ||
| 2/18/2008 | Price change | $402,000+41.1%$125/sqft |
Source: NCI #Basil Report a problem | ||
| 2/16/2008 | Listed for sale | $284,900$89/sqft |
Source: NCI #Basil Report a problem | ||
| Year | Property taxes | Tax assessment |
|---|---|---|
| 2025 | $4,809 +6.3% | $304,443 +10% |
| 2024 | $4,524 +2.1% | $276,766 +10% |
| 2023 | $4,431 +18% | $251,605 +10% |
| 2022 | $3,754 +19.9% | $228,732 +10% |
| 2021 | $3,131 +5.6% | $207,938 +5.6% |
| 2020 | $2,965 +0.7% | $196,832 +5% |
| 2019 | $2,943 +7.6% | $187,499 +2% |
| 2018 | $2,735 | $183,847 +18.4% |
| 2017 | $2,735 +11.9% | $155,317 +12.6% |
| 2016 | $2,443 +6.6% | $137,962 +3.2% |
| 2015 | $2,291 +0.7% | $133,747 +0.2% |
| 2014 | $2,274 -6.9% | $133,510 -4.6% |
| 2013 | $2,443 +36.9% | $139,890 +25.1% |
| 2012 | $1,785 -11.3% | $111,806 -11.1% |
| 2011 | $2,013 -6.8% | $125,815 -8.9% |
| 2010 | $2,159 -16% | $138,127 -12.2% |
| 2009 | $2,570 -9.5% | $157,244 -10.2% |
| 2008 | $2,841 -6.2% | $175,077 -11.5% |
| 2007 | $3,029 -13.8% | $197,800 -5.4% |
| 2006 | $3,514 +13.9% | $209,200 +22.7% |
| 2005 | $3,085 +25.8% | $170,500 +31.8% |
| 2004 | $2,452 +1277.8% | $129,400 +1220.4% |
| 2003 | $178 +12.1% | $9,800 +14% |
| 2002 | $159 | $8,600 |
Find assessor info on the county website
Source: The MLS. This data may not be complete. We recommend contacting the local school district to confirm school assignments for this home.