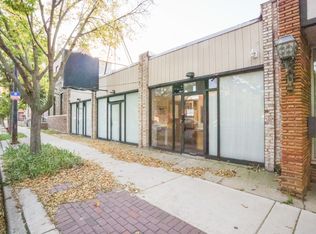
PRIME BROADWAY DEVELOPMENT SITE IN EDGEWATER (B3-5 UP-ZONING) Outstanding opportunity for developers and investors to acquire a prime 6,750 SF development site (54' x 125') along the vibrant Broadway commercial corridor in Chicago's dynamic Edgewater neighborhood. KEY HIGHLIGHTS: Zoning & Density: Recently up-zoned to B3-5 as part of the city-led Broadway Corridor initiative, allowing a Floor Area Ratio (FAR) of 5.0 and an MLA per unit of 200-enabling development of up to 33 dwelling units with ground-floor commercial space or a boutique multi-family project. Prime Transit-Oriented Location (TOD): Situated just steps from the Thorndale CTA Red Line station, with immediate access to Lake Shore Drive and Lake Michigan. Strong Community Anchors: Bounded by high-foot-traffic retail, dining, and vibrant residential blocks, located in close proximity to Loyola University Chicago (17,000+ students and 1,600+ faculty). Property Parcel Details: PIN 14053150300000; 2025 Annual Real Estate Taxes: $13,324.37. Don't miss this chance to build in one of the North Side's most resilient and accessible lakefront transit corridors!
Active
$975,000
5828 N Broadway St, Chicago, IL 60660
--beds
--baths
6,534Square Feet
Unimproved Land
Built in ----
6,534 Square Feet Lot
$-- Zestimate®
$--/sqft
$-- HOA
What's special
- 45 days
- 152
- 7
Zillow last checked:
Listing updated:
Listed by:
Niko Apostal 773-516-0661,
Essex 312, LLC
Source: MRED as distributed by MLS GRID,MLS#: 12777538
Facts & features
Property
Features
- Frontage length: 54
Lot
- Size: 6,534 Square Feet
- Dimensions: 54 x 125
Details
- Parcel number: 14053150300000
- Zoning: COMMR
- Special conditions: None
Utilities & green energy
- Utilities for property: Unknown (verify)
Community & HOA
Location
- Region: Chicago
Financial & listing details
- Tax assessed value: $691,880
- Annual tax amount: $13,324
- Date on market: 10/5/2026
- Ownership: Fee Simple
- Road surface type: Asphalt
Estimated market value
Not available
Estimated sales range
Not available
Not available
Price history
| Date | Event | Price |
|---|---|---|
| 10/5/2026 | Listed for sale | $975,000-13.3% |
Source:  MRED as distributed by MLS GRID #12777538 Report a problem | ||
| 5/31/2026 | Listing removed | $1,125,000 |
Source: MRED as distributed by MLS GRID #12519540 Report a problem | ||
| 1/9/2026 | Price change | $1,125,000-10% |
Source: MRED as distributed by MLS GRID #12519540 Report a problem | ||
| 11/17/2025 | Listed for sale | $1,250,000+78.8% |
Source: MRED as distributed by MLS GRID #12519540 Report a problem | ||
| 6/6/2022 | Sold | $699,000 |
Source: MRED as distributed by MLS GRID #11275743 Report a problem | ||
| 1/4/2022 | Pending sale | $699,000 |
Source: MRED as distributed by MLS GRID #11275743 Report a problem | ||
| 12/16/2021 | Contingent | $699,000 |
Source: MRED as distributed by MLS GRID #11275743 Report a problem | ||
| 11/23/2021 | Listed for sale | $699,000 |
Source: MRED as distributed by MLS GRID #11275743 Report a problem | ||
Public tax history
| Year | Property taxes | Tax assessment |
|---|---|---|
| 2024 | $12,904 +2.9% | $69,188 +23.5% |
| 2023 | $12,546 +2.5% | $56,025 |
| 2022 | $12,236 +2.2% | $56,025 |
| 2021 | $11,978 +53.3% | $56,025 +69.4% |
| 2020 | $7,813 +10.9% | $33,075 |
| 2019 | $7,046 +1.6% | $33,075 |
| 2018 | $6,935 +5% | $33,075 +14% |
| 2017 | $6,604 +7.4% | $29,025 |
| 2016 | $6,151 +9% | $29,025 |
| 2015 | $5,642 +28% | $29,025 +30.3% |
| 2014 | $4,409 +1.5% | $22,275 |
| 2013 | $4,342 +1.6% | $22,275 |
| 2012 | $4,276 -7.8% | $22,275 -15.4% |
| 2011 | $4,637 -0.4% | $26,325 |
| 2010 | $4,658 +5.3% | $26,325 |
| 2009 | $4,423 +14.4% | $26,325 +5.2% |
| 2008 | $3,865 +1.6% | $25,012 |
| 2007 | $3,806 -0.6% | $25,012 |
| 2006 | $3,830 +6.2% | $25,012 +21.9% |
| 2005 | $3,606 +2.4% | $20,520 |
| 2004 | $3,520 | $20,520 |
Find assessor info on the county website
Monthly payment
Climate risks
Neighborhood: Magnolia Glen
Nearby schools


Similar homes
- $695,0006,098 sqft2833 W Howard St, Chicago, IL 60645Active
 MLS ID #12788608, Jacob Blieden, Aria Real Estate. MRED as distributed by MLS GRID
- $924,0006,922 sqft3319 W Fullerton Ave, Chicago, IL 60647Active
 MLS ID #12796852, Karen Biazar, North Clybourn Group, Inc.. MRED as distributed by MLS GRID
- $1,197,7704,323 sqft1313 W Ancona St, Chicago, IL 60642Active
 MLS ID #12806362, Malwina Smosna, Chicagoland Brokers, Inc.. MRED as distributed by MLS GRID
- $600,0006,098 sqft4387 N Elston Ave, Chicago, IL 60641Active
 MLS ID #12731443, Hadley Rue, Baird & Warner. MRED as distributed by MLS GRID
