Prime South Miami investment opportunity just 3 blocks from the University of Miami. Duplex on a 6,300 SF lot with potentially generating $7,000/month, new roof, updated plumbing, separate water/electric meters, and parking for approximately 9–10 vehicles. Multifamily zoning offers excellent redevelopment potential. Close to Coral Gables, Downtown South Miami, transit, and Sunset Place. 24-hour notice required.
For sale
$799,000
5925 SW 64th St, South Miami, FL 33143
4beds
3baths
1,144sqft
Duplex
Built in 1947
-- sqft lot
$-- Zestimate®
$698/sqft
$-- HOA
What's special
Updated plumbingNew roof
- 14 days
- 536
- 22
Likely to sell faster than
Zillow last checked:
Listing updated:
Listed by:
Jhon Salazar PA 786-426-4197,
Real Estate Craft, LLC.
Source: MIAMI,MLS#: A12100404 Originating MLS: A-Miami Association of REALTORS
Facts & features
Interior
Bedrooms & bathrooms
- Bedrooms: 4
- Bathrooms: 3
Heating
- Central
Cooling
- Central Air
Features
- Flooring: Tile
Interior area
- Total structure area: 1,300
- Total interior livable area: 1,144 sqft
Video & virtual tour
Property
Parking
- Total spaces: 10
Features
- Stories: 1
Lot
- Features: 1/4 To Less Than 1/2 Acre Lot
Details
- Parcel number: 0940250340220
- Zoning: 0800
Construction
Type & style
- Home type: MultiFamily
- Property subtype: Duplex
Materials
- CBS Construction
- Roof: Flat Tile
Condition
- Year built: 1947
Utilities & green energy
- Sewer: Other, Septic Tank
Community & HOA
Community
- Subdivision: Stormproof Sub
HOA
- Has HOA: No
Location
- Region: South Miami
Financial & listing details
- Price per square foot: $698/sqft
- Tax assessed value: $512,909
- Annual tax amount: $4,264
- Date on market: 10/4/2026
- Listing terms: All Cash,Conventional,FHA,VA Loan
Estimated market value
Not available
Estimated sales range
Not available
Not available
Price history
| Date | Event | Price |
|---|---|---|
| 10/4/2026 | Listed for sale | $799,000$698/sqft |
Source:  MIAMI #A12100404 Report a problem | ||
| 10/4/2026 | Listing removed | $799,000$698/sqft |
Source:  Douglas Elliman #A12010002 Report a problem | ||
| 9/11/2026 | Price change | $799,000-0.1%$698/sqft |
Source: MIAMI #A12010002 Report a problem | ||
| 5/15/2026 | Pending sale | $800,000$699/sqft |
Source: MIAMI #A12010002 Report a problem | ||
| 4/29/2026 | Listed for sale | $800,000+7.4%$699/sqft |
Source: MIAMI #A12010002 Report a problem | ||
| 7/14/2025 | Listing removed | $745,000$651/sqft |
Source: MIAMI #A11734621 Report a problem | ||
| 4/25/2025 | Price change | $745,000-6.3%$651/sqft |
Source: MIAMI #A11734621 Report a problem | ||
| 2/19/2025 | Listed for sale | $795,000+99.2%$695/sqft |
Source: MIAMI #A11734621 Report a problem | ||
| 12/3/2020 | Listing removed | $399,000$349/sqft |
Source: Keller Williams Realty Premier #A10756742 Report a problem | ||
| 12/1/2020 | Listed for sale | $399,000$349/sqft |
Source: Keller Williams Realty Premier #A10756742 Report a problem | ||
| 10/30/2020 | Listing removed | $399,000$349/sqft |
Source: Keller Williams Realty Premier #A10756742 Report a problem | ||
| 8/30/2020 | Listed for sale | $399,000$349/sqft |
Source: Keller Williams Realty Premier #A10756742 Report a problem | ||
| 4/10/2020 | Listing removed | $399,000$349/sqft |
Source: Keller Williams Realty Premier #A10756742 Report a problem | ||
| 4/9/2020 | Listed for sale | $399,000$349/sqft |
Source: Keller Williams Realty Premier #A10756742 Report a problem | ||
| 2/18/2020 | Listing removed | $399,000$349/sqft |
Source: Keller Williams Realty Premier Properties #A10756742 Report a problem | ||
| 10/15/2019 | Listed for sale | $399,000+33.4%$349/sqft |
Source: Keller Williams Realty Premier #A10756742 Report a problem | ||
| 4/6/2016 | Listing removed | $299,000$261/sqft |
Source: Realty World M Realty Group #A10045830 Report a problem | ||
| 8/21/2015 | Listed for sale | $299,000+221.5%$261/sqft |
Source: Keller Williams - Miami Kendall #A2162280 Report a problem | ||
| 12/6/2011 | Sold | $93,000-23.8%$81/sqft |
Source: Public Record Report a problem | ||
| 2/6/2003 | Sold | $122,000$107/sqft |
Source: Public Record Report a problem | ||
Public tax history
| Year | Property taxes | Tax assessment |
|---|---|---|
| 2025 | $3,958 +11.4% | $179,658 +7.8% |
| 2024 | $3,553 +9.9% | $166,585 +7.8% |
| 2023 | $3,232 +10.9% | $154,560 +7.7% |
| 2022 | $2,914 +11.3% | $143,538 +7.6% |
| 2021 | $2,618 +19.5% | $133,430 +6.9% |
| 2020 | $2,191 +10.3% | $124,863 +7.1% |
| 2019 | $1,986 +13.9% | $116,630 +6.8% |
| 2018 | $1,744 +16.3% | $109,246 +6.7% |
| 2017 | $1,500 +12.3% | $102,390 +6.6% |
| 2016 | $1,336 +15.1% | $96,094 +5.7% |
| 2015 | $1,161 +9.4% | $90,879 +5.6% |
| 2014 | $1,061 -38.6% | $86,073 +5.7% |
| 2013 | $1,727 | $81,394 +0.2% |
| 2012 | $1,727 -37.3% | $81,267 -23% |
| 2011 | $2,754 -7.2% | $105,540 -17.1% |
| 2010 | $2,969 -14.2% | $127,380 -19% |
| 2009 | $3,459 -21.9% | $157,288 -23.8% |
| 2007 | $4,429 +53.6% | $206,295 |
| 2006 | $2,884 | -- |
| 2005 | $2,884 +14.9% | -- |
| 2004 | $2,510 +39.1% | -- |
| 2003 | $1,804 +46.3% | -- |
| 2002 | $1,233 | -- |
| 2001 | $1,233 | -- |
Find assessor info on the county website
Monthly payment
Est. payment
Payment breakdown
Explore the cost of this home by adjusting the details. Changes won't be saved.Climate risks
Neighborhood: South Miami

Similar homes
- $--3 bd2 ba1.5k sqft9431 SW 65th St, Miami, FL 33173Auction
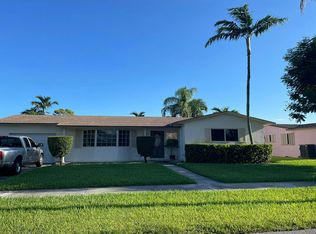 Auction.com 2
- $750,0003 bd2 ba1.6k sqftHeftler Homes Sunset Park, Miami, FL 33173For Sale

 MLS ID #A12102259, Nilda Tejedor, Beachfront Realty Inc. MIAMI
- $775,0005 bd2 ba1.5k sqftSylvania Heights Resub, West Miami, FL 33144For Sale
 MLS ID #A12065058, Celia Andonie, Keller Williams Capital Realty. MIAMI
- $1,074,0004 bd2 ba1.4k sqftKendal Park, Miami, FL 33156For Sale
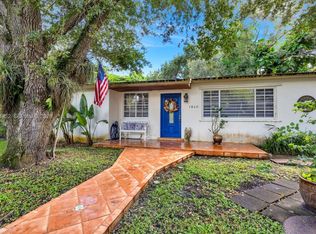 MLS ID #A12104952, Jonathan Gilman, Coldwell Banker Realty. MIAMI
- $724,9994 bd3 ba1.5k sqftLee Manor, Miami, FL 33165For SaleMLS ID #A12072310, Josel Aloma-Fernandez PA, IBuy SFL. MIAMI
- $699,0003 bd1 ba1.3k sqftCentral Miami Part 6, Miami, FL 33155For SaleMLS ID #A12077947, Brittany Borges, TIM Realty, LLC.. MIAMI
- $640,0003 bd1 ba936 sqftWestwood Lake 11th Addn, Miami, FL 33165For SaleMLS ID #A12099361, Alexandra Haslam, Dalton Wade Inc. MIAMI
- $565,0004 bd2 ba1.1k sqftMelrose Heights, Miami, FL 33142For SaleMLS ID #A12075197, Miguel Fuentes, Fausto Commercial Realty Consultants Inc. MIAMI
- $600,0004 bd2 ba1.4k sqftHigh Point, Miami, FL 33125For SaleMLS ID #A11999633, Jeffrey Stone, Beachfront Realty Inc. MIAMI
- $590,0004 bd2 ba1.4k sqftFeatherstone Ridge, Miami, FL 33142For SaleMLS ID #A12075187, Miguel Fuentes, Fausto Commercial Realty Consultants Inc. MIAMI
- $630,0003 bd2 ba1.2k sqftMarket Condo, Miami, FL 33144For SaleMLS ID #A12016113, Antonio Saladrigas, Fausto Commercial Realty Consultants Inc. MIAMI
- $450,0003 bd2 ba1.4k sqftHolleman Manor Addn, Miami, FL 33142For SaleMLS ID #A12106131, Gregory Celentano, Union Street Partners, LLC. MIAMI
- $689,9005 bd3 ba1.6k sqftTown Of Hialeah 1 Addn Am, Hialeah, FL 33010For SaleMLS ID #A12041771, Lena Borrayo PA, Modern World Realty. MIAMI
- $650,0004 bd2 ba1.7k sqftDrysdale Manor, Miami, FL 33168For SaleMLS ID #A12100382, Gerry Young, INMO Brokers Group, LLC.. MIAMI
- $780,0003 bd1 ba1k sqftHialeah 16 Addn Amd & Rev, Hialeah, FL 33013For SaleMLS ID #A12036405, Maria Diaz, Brickell Realty Group International. MIAMI
- $795,0003 bd2 ba1.3k sqftBiscayne Blvd Park, Miami, FL 33161For SaleMLS ID #A12085880, Moises Btesh, Related General Realty, LLC.. MIAMI
