$124,600
3 bd|1 ba|1.5k sqft
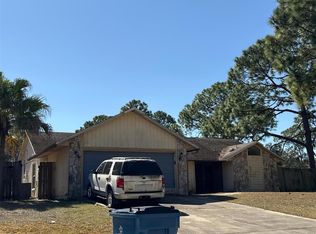
604 Roberts St, Melbourne, FL 32901
Off Market
Likely to sell faster than
Zillow last checked:
Listing updated:
Ludmilla Rogof 772-626-9638,
Prime Realty & Investments LLC
$240,900
$229,000 - $253,000
$1,947/mo
| Date | Event | Price |
|---|---|---|
| 5/22/2026 | Listed for sale | $250,000+228.9%$185/sqft |
Source: | ||
| 12/4/2019 | Sold | $76,000-10.6%$56/sqft |
Source: Public Record Report a problem | ||
| 12/2/2019 | Price change | $85,000-10.5%$63/sqft |
Source: North America Realty Group #859032 Report a problem | ||
| 11/13/2019 | Price change | $95,000-9.5%$70/sqft |
Source: North America Realty Group #859032 Report a problem | ||
| 11/4/2019 | Price change | $105,000-8.7%$78/sqft |
Source: North America Realty Group #859032 Report a problem | ||
| 10/24/2019 | Listed for sale | $115,000+379.2%$85/sqft |
Source: North America Realty Group #859032 Report a problem | ||
| 11/4/2014 | Sold | $24,000-4%$18/sqft |
Source: Space Coast AOR #698770 Report a problem | ||
| 8/19/2014 | Price change | $25,000-16.7%$19/sqft |
Source: Coldwell Banker Residential Real Estate - Melbourne #698770 Report a problem | ||
| 8/2/2014 | Price change | $30,000-7.7%$22/sqft |
Source: Coldwell Banker Residential Real Estate - Melbourne #698770 Report a problem | ||
| 6/7/2014 | Listed for sale | $32,500-38.2%$24/sqft |
Source: Coldwell Banker Res RE #698770 Report a problem | ||
| 5/20/2014 | Sold | $52,600$39/sqft |
Source: Public Record Report a problem | ||
| Year | Property taxes | Tax assessment |
|---|---|---|
| 2025 | $1,583 +14.5% | $113,830 +16.9% |
| 2024 | $1,382 +18.2% | $97,410 +36.1% |
| 2023 | $1,170 +13.7% | $71,590 +12.9% |
| 2022 | $1,029 +12.9% | $63,410 +41% |
| 2021 | $911 +4.7% | $44,980 +5.9% |
| 2020 | $871 -0.8% | $42,470 -4.6% |
| 2019 | $878 | $44,500 -5.5% |
| 2018 | $878 +1.6% | $47,080 +38.3% |
| 2017 | $864 +14.1% | $34,030 +7.1% |
| 2016 | $758 +2.7% | $31,780 +17.1% |
| 2015 | $738 +21.6% | $27,150 +14.6% |
| 2014 | $607 | $23,690 +6.6% |
| 2013 | -- | $22,230 +5% |
| 2012 | $466 -21.4% | $21,170 -21.3% |
| 2011 | $593 -20% | $26,900 -27.5% |
| 2010 | $741 -4.7% | $37,120 -11.7% |
| 2009 | $778 -16.4% | $42,060 -18.8% |
| 2008 | $930 -31.9% | $51,800 -32.6% |
| 2007 | $1,366 -6.2% | $76,800 +27.9% |
| 2005 | $1,457 +15.2% | $60,030 +35% |
| 2004 | $1,265 +10.8% | $44,460 -13.2% |
| 2003 | $1,142 +12.6% | $51,250 +10.5% |
| 2002 | $1,014 +39.5% | $46,400 +9.3% |
| 2001 | $727 +23.9% | $42,470 +6.1% |
| 2000 | $587 | $40,030 |
Find assessor info on the county website
A local agent can set up tours, give advice and negotiate with sellers.