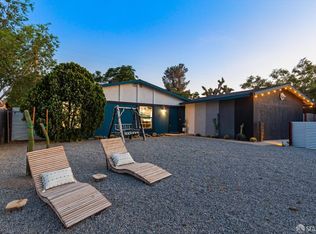
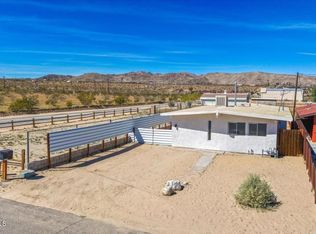
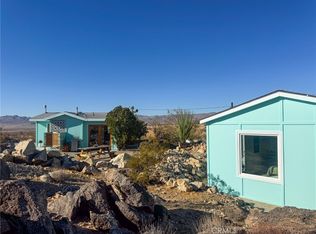
This 825 square foot single family home has 2 bedrooms and 1.0 bathrooms. This home is located at 61589 S El Reposo St, Joshua Tree, CA 92252.
Pre-foreclosure
Est. $456,500
61589 S El Reposo St, Joshua Tree, CA 92252
2beds
825sqft
SingleFamily
Built in 1973
8,280 Square Feet Lot
$456,500 Zestimate®
$553/sqft
$-- HOA
Overview
- 95 days |
- 5 |
- 0 |
Facts & features
Interior
Bedrooms & bathrooms
- Bedrooms: 2
- Bathrooms: 1
- Full bathrooms: 1
Heating
- Forced air
Cooling
- Wall
Appliances
- Included: Dishwasher, Dryer, Range / Oven, Refrigerator, Washer
- Laundry: Laundry Room
Features
- Living Room, Open Floorplan
- Flooring: Concrete
- Has fireplace: Yes
- Common walls with other units/homes: Ground
Interior area
- Structure area source: Assessor
- Total interior livable area: 825 sqft
Property
Parking
- Total spaces: 2
- Parking features: Garage - Detached
Features
- Entry location: Ground,Ground Level - No Steps
- Fencing: Fenced, Other, Block
- Has view: Yes
- View description: Mountain
Lot
- Size: 8,280 Square Feet
- Features: Views
Details
- Parcel number: 0602264020000
- Special conditions: Standard
Construction
Type & style
- Home type: SingleFamily
Materials
- wood frame
- Roof: Built-up
Condition
- Year built: 1973
Utilities & green energy
- Sewer: Septic Tank
Community & HOA
Community
- Security: Security System Leased
Location
- Region: Joshua Tree
Financial & listing details
- Price per square foot: $553/sqft
- Tax assessed value: $510,000
- Annual tax amount: $6,295
- Lease term: Short Term Lease
Visit our professional directory to find a foreclosure specialist in your area that can help with your home search.
Find a foreclosure agentForeclosure details
Estimated market value
$456,500
$415,000 - $498,000
$1,909/mo
Price history
| Date | Event | Price |
|---|---|---|
| 5/24/2023 | Listing removed | -- |
Source: | ||
| 3/2/2023 | Listed for sale | $699,000+16.5%$847/sqft |
Source: | ||
| 5/27/2022 | Sold | $600,000+160.9%$727/sqft |
Source: Public Record Report a problem | ||
| 11/1/2021 | Sold | $230,000+411.1%$279/sqft |
Source: Public Record Report a problem | ||
| 3/19/2013 | Listing removed | $700$1/sqft |
Source: Tri Valley Realty Report a problem | ||
| 2/9/2013 | Listed for rent | $700$1/sqft |
Source: Tri Valley Realty Report a problem | ||
| 4/1/2009 | Sold | $45,000-30.7%$55/sqft |
Source: Public Record Report a problem | ||
| 12/11/2008 | Listing removed | $64,900$79/sqft |
Source: foreclosure.com Report a problem | ||
| 12/6/2008 | Price change | $64,900-7.9%$79/sqft |
Source: foreclosure.com Report a problem | ||
| 11/13/2008 | Listed for sale | -- |
Source: foreclosure.com Report a problem | ||
| 10/31/2008 | Sold | $70,500-52.2%$85/sqft |
Source: Public Record Report a problem | ||
| 7/24/2006 | Sold | $147,500+309.7%$179/sqft |
Source: Public Record Report a problem | ||
| 7/17/2000 | Sold | $36,000$44/sqft |
Source: Public Record Report a problem | ||
Public tax history
| Year | Property taxes | Tax assessment |
|---|---|---|
| 2025 | $6,295 -14.7% | $510,000 -18.3% |
| 2024 | $7,378 +2% | $624,240 +2% |
| 2023 | $7,236 +146.9% | $612,000 +166.1% |
| 2022 | $2,931 +207.5% | $230,000 +329.6% |
| 2021 | $953 +1% | $53,537 +1% |
| 2020 | $944 -3.7% | $52,988 +2% |
| 2019 | $980 -71.6% | $51,949 +2% |
| 2018 | $3,456 +328.4% | $50,930 +2% |
| 2017 | $807 | $49,931 +2% |
| 2016 | $807 +1.5% | $48,952 +1.5% |
| 2015 | $795 +1.8% | $48,217 +2% |
| 2014 | $781 | $47,272 +0.5% |
| 2013 | -- | $47,059 +2% |
| 2012 | -- | $46,136 +2% |
| 2011 | -- | $45,231 +0.8% |
| 2010 | -- | $44,893 -43.9% |
| 2009 | -- | $80,000 +93.7% |
| 2008 | -- | $41,299 +2% |
| 2007 | -- | $40,489 +2% |
| 2006 | -- | $39,695 +2% |
| 2005 | -- | $38,916 +2% |
| 2004 | -- | $38,153 +1.9% |
| 2003 | -- | $37,454 +2% |
| 2002 | -- | $36,720 +2% |
| 2001 | -- | $36,000 +62.2% |
| 2000 | -- | $22,196 |
Find assessor info on the county website
Monthly payment
Estimated monthly payment$1,822
All calculations are estimates and provided by Zillow, Inc. for informational purposes only. Actual amounts may vary.
HOA fees may include property taxes on listings classified as Co-Ops. Contact the listing agent and/or owner for fee details.
Mortgage interest rates are dependent on a number of factors, including credit score, down payment, and repayment length. Interest rate data provided by Zillow Group Marketplace, Inc. as of 1/1/1970 from various mortgage lenders with which we have lead or other similar arrangements; the Estimated Payment is an average of those rates.
See how much you could borrow to make a competitive offer.
Climate risks
Neighborhood: 92252
Nearby schools
GreatSchools rating
- 4/10Joshua Tree Elementary SchoolGrades: K-6Distance: 2.3 mi
- 3/10La Contenta Middle SchoolGrades: 7-8Distance: 3 mi
- 4/10Yucca Valley High SchoolGrades: 9-12Distance: 6.1 mi
Schools provided by the listing agent
- District: Morongo Unified
Source: The MLS. This data may not be complete. We recommend contacting the local school district to confirm school assignments for this home.


- California
- San Bernardino County
- Joshua Tree
- 92252
- 61589 S El Reposo St
Nearby cities
Nearby zip codes
Other Joshua Tree Topics
