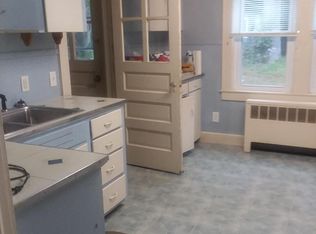
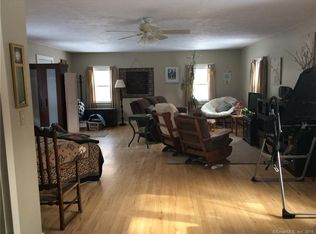
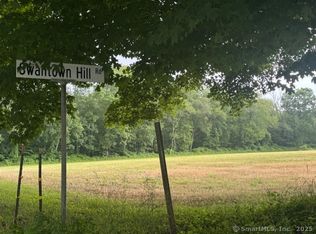
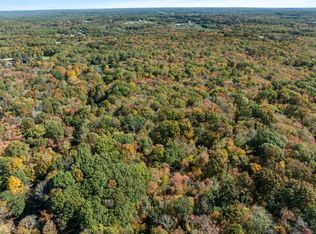
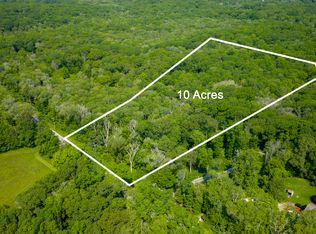
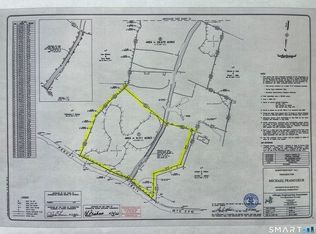
Prime 8.31-acre development opportunity located just 4.5 miles (approx. 10 minutes) from Foxwoods Resort Casino, positioned directly on Norwich Westerly Road (Route 2). This property offers approximately 900 feet of road frontage with additional frontage on Swantown Hill Road, providing excellent access and flexibility for future subdivision. The parcel is grandfathered for residential subdivision, making it ideal for builders, developers, or investors seeking to create multiple single-family home sites. The land is dry and usable with no wetlands, significantly reducing development constraints. An existing single-family home is currently on the property and may be renovated, rented, or removed depending on your vision. Located in a desirable rural setting with strong proximity to major attractions, highways, and southeastern Connecticut amenities, this property presents a rare opportunity to secure a large, buildable parcel in a high-demand corridor. Buyers must perform their own diligence. Seller's financing available House is unsafe to walk; the land is free to walk.
Lot/land
Street View
$449,999
616 Norwich Westerly Road, North Stonington, CT 06359
--beds
--baths
8.31Acres
Unimproved Land
Built in ----
8.31 Acres Lot
$-- Zestimate®
$--/sqft
$-- HOA
What's special
- 19 days |
- 208 |
- 9 |
Zillow last checked:
Listing updated:
Listed by:
Charles Harris (860)414-4579,
CLMA Realty 203-479-0722
Source: Smart MLS,MLS#: 24180341
Facts & features
Interior
Interior area
- Total structure area: 0
Property
Features
- Frontage length: 200
Lot
- Size: 8.31 Acres
- Features: Corner Lot, Few Trees, Dry, Level, Cleared, Approved Subdivision, Highway Access
Details
- Additional structures: Residence
- Parcel number: 1535942
- Zoning: R80
Utilities & green energy
- Sewer: Septic Tank
- Water: Well
- Utilities for property: Electricity Available
Community & HOA
HOA
- Has HOA: No
Location
- Region: North Stonington
Financial & listing details
- Tax assessed value: $148,260
- Annual tax amount: $4,282
- Date on market: 6/9/2026
- Electric utility on property: Yes
Estimated market value
Not available
Estimated sales range
Not available
$1,705/mo
Price history
| Date | Event | Price |
|---|---|---|
| 6/9/2026 | Listed for sale | $449,999-18.2% |
Source: | ||
| 6/1/2026 | Listing removed | $549,999 |
Source: | ||
| 5/18/2026 | Price change | $549,999+10% |
Source: | ||
| 5/17/2026 | Price change | $499,999-16.7% |
Source: | ||
| 4/1/2026 | Listed for sale | $599,999-14.3% |
Source: | ||
| 2/7/2026 | Listing removed | $700,000 |
Source: | ||
| 8/9/2025 | Listed for sale | $700,000-12.5% |
Source: | ||
| 8/28/2024 | Listing removed | $800,000 |
Source: | ||
| 6/17/2024 | Listed for sale | $800,000+14.3% |
Source: | ||
| 8/23/2022 | Listing removed | -- |
Source: | ||
| 4/1/2020 | Price change | $700,000+40.3% |
Source: Ocean Front Homes, LLC #170122896 Report a problem | ||
| 9/7/2018 | Listed for sale | $499,000+10.9% |
Source: Ocean Front Homes, LLC #170122896 Report a problem | ||
| 5/6/2005 | Sold | $450,000+143.2% |
Source: Public Record Report a problem | ||
| 3/10/2004 | Sold | $185,000 |
Source: Public Record Report a problem | ||
Public tax history
| Year | Property taxes | Tax assessment |
|---|---|---|
| 2025 | $4,282 | $148,260 |
| 2024 | $4,282 -0.4% | $148,260 |
| 2023 | $4,298 +1.9% | $148,260 |
| 2022 | $4,218 -0.5% | $148,260 |
| 2021 | $4,240 -1.1% | $148,260 +2% |
| 2020 | $4,287 +1.7% | $145,320 |
| 2019 | $4,214 +2.8% | $145,320 |
| 2018 | $4,098 +4.4% | $145,320 |
| 2017 | $3,924 | $145,320 |
| 2016 | $3,924 +1.1% | $145,320 -2.3% |
| 2015 | $3,882 +1% | $148,750 |
| 2014 | $3,845 +1% | $148,750 |
| 2013 | $3,808 -27.4% | $148,750 -42.4% |
| 2011 | $5,244 +0.5% | $258,440 0% |
| 2010 | $5,219 +1.2% | $258,510 |
| 2009 | $5,155 +2.3% | $258,510 |
| 2008 | $5,041 +4.8% | $258,510 |
| 2007 | $4,808 | $258,510 |
| 2006 | $4,808 +83.2% | $258,510 +195.4% |
| 2005 | $2,625 +1.7% | $87,500 |
| 2004 | $2,581 +3.5% | $87,500 |
| 2003 | $2,494 +15.7% | $87,500 +9.6% |
| 2001 | $2,155 -10.1% | $79,800 -20.1% |
| 1995 | $2,396 | $99,820 |
Find assessor info on the county website
Monthly payment
Estimated monthly payment$1,822
All calculations are estimates and provided by Zillow, Inc. for informational purposes only. Actual amounts may vary.
HOA fees may include property taxes on listings classified as Co-Ops. Contact the listing agent and/or owner for fee details.
Mortgage interest rates are dependent on a number of factors, including credit score, down payment, and repayment length. Interest rate data provided by Zillow Group Marketplace, Inc. as of 1/1/1970 from various mortgage lenders with which we have lead or other similar arrangements; the Estimated Payment is an average of those rates.
See how much you could borrow to make a competitive offer.
Climate risks
Neighborhood: 06359
Getting around
0 / 100
Car-DependentNearby schools
GreatSchools rating
- 7/10North Stonington Elementary SchoolGrades: PK-6Distance: 2.6 mi
- 6/10Wheeler High SchoolGrades: 7-12Distance: 2.7 mi
A local agent can set up tours, give advice and negotiate with sellers.


- Connecticut
- New London County
- North Stonington
- 06359
- 616 Norwich Westerly Road
Nearby cities
Nearby zip codes
Other North Stonington Topics
- Apartments for Rent in 06359
- Houses for Sale in 06359
- Houses for Rent in 06359
- 06359 Real Estate
- North Stonington Condos
- Houses for Sale in North Stonington
- Newest Listings in North Stonington
- North Stonington Home Values
- North Stonington Real Estate Agents
- North Stonington Refinance
- North Stonington Mortgage Rates
