Great investment opportunity in Providence’s Elmhurst area! This well-maintained 3-family property offers three spacious units, providing an excellent opportunity for an investor or owner-occupant. The property features a desirable layout, with multiple bedrooms and comfortable living spaces in each unit. Conveniently located near shopping, restaurants, public transportation, and major highways, this property offers both flexibility and accessibility. With strong rental potential and multiple units, 62 Oakland Ave is a great opportunity to add to your portfolio or live in one unit while generating rental income from the others. Schedule your showing today!
Active
Price cut: $25K (11/18)
$725,000
62 Oakland Ave, Providence, RI 02908
9beds
3,978sqft
Multi Family
Built in 1930
-- sqft lot
$716,300 Zestimate®
$182/sqft
$-- HOA
What's special
- 46 days
- 489
- 41
Zillow last checked:
Listing updated:
Listed by:
Chanthrea Ou 401-419-5368,
Strive Realty
Source: StateWide MLS RI,MLS#: 1425340
Facts & features
Interior
Bedrooms & bathrooms
- Bedrooms: 9
- Bathrooms: 3
- Full bathrooms: 3
Heating
- Natural Gas, Forced Air, Hot Air
Cooling
- Window Unit(s)
Appliances
- Included: Gas Water Heater
Features
- Flooring: Hardwood
- Basement: Full,Interior Entry,Unfinished
- Has fireplace: No
Interior area
- Total structure area: 3,840
- Total interior livable area: 3,978 sqft
Video & virtual tour
Property
Parking
- Parking features: No Garage
Lot
- Size: 3,293 Square Feet
Details
- Parcel number: PROVM82L85
Construction
Type & style
- Home type: MultiFamily
- Property subtype: Multi Family
- Attached to another structure: Yes
Materials
- Vinyl Siding
Condition
- New construction: No
- Year built: 1930
Utilities & green energy
- Electric: 100 Amp Service
- Sewer: Public Connected
- Water: Public
- Utilities for property: Water Connected
Community & HOA
HOA
- Has HOA: No
Location
- Region: Providence
Financial & listing details
- Price per square foot: $182/sqft
- Tax assessed value: $647,300
- Annual tax amount: $9,064
- Date on market: 10/7/2026
- Total actual rent: 6250
- Tenant pays: Heat
Estimated market value
$716,300
$680,000 - $752,000
$3,054/mo
Price history
| Date | Event | Price |
|---|---|---|
| 11/18/2026 | Price change | $725,000-3.3%$182/sqft |
Source:  StateWide MLS RI #1425340 Report a problem | ||
| 10/12/2026 | Listed for sale | $750,000+345.1%$189/sqft |
Source: StateWide MLS RI #1425340 Report a problem | ||
| 3/29/2019 | Listing removed | $1,950 |
Source: Zillow Rental Manager Report a problem | ||
| 3/6/2019 | Price change | $1,950-87.8% |
Source: Zillow Rental Manager Report a problem | ||
| 2/4/2019 | Listed for rent | $16,000+720.5%$4/sqft |
Source: Owner Report a problem | ||
| 12/16/2018 | Listing removed | $1,950 |
Source: Owner Report a problem | ||
| 11/14/2018 | Listed for rent | $1,950 |
Source: Owner Report a problem | ||
| 4/15/2018 | Listing removed | $1,950 |
Source: Owner Report a problem | ||
| 11/10/2017 | Listed for rent | $1,950 |
Source: Owner Report a problem | ||
| 4/30/2017 | Listing removed | $1,950 |
Source: Owner Report a problem | ||
| 3/31/2017 | Listed for rent | $1,950 |
Source: Owner Report a problem | ||
| 4/1/2016 | Sold | $168,500-15.7%$42/sqft |
Source: Public Record Report a problem | ||
| 12/30/2015 | Listing removed | $199,900$50/sqft |
Source: Broadway Real Estate Group #1108229 Report a problem | ||
| 10/14/2015 | Price change | $199,900-4.8%$50/sqft |
Source: Broadway Real Estate Group #1108229 Report a problem | ||
| 9/19/2015 | Listed for sale | $210,000-28.1%$53/sqft |
Source: Broadway Real Estate Group #1108229 Report a problem | ||
| 9/2/2004 | Sold | $292,000$73/sqft |
Source: Public Record Report a problem | ||
Public tax history
| Year | Property taxes | Tax assessment |
|---|---|---|
| 2025 | $9,062 +23.1% | $647,300 +61.3% |
| 2024 | $7,362 +3.1% | $401,200 |
| 2023 | $7,141 | $401,200 |
| 2022 | $7,141 +25.4% | $401,200 +73% |
| 2021 | $5,695 0% | $231,900 |
| 2020 | $5,695 | $231,900 |
| 2019 | $5,695 +8% | $231,900 +40.5% |
| 2018 | $5,273 +0% | $165,000 |
| 2017 | $5,273 | $165,000 |
| 2016 | $5,273 +10.8% | $165,000 +14.7% |
| 2015 | $4,760 -1.9% | $143,800 |
| 2013 | $4,853 +3.1% | $143,800 -2.6% |
| 2012 | $4,707 | $147,600 |
| 2011 | $4,707 +5% | $147,600 |
| 2010 | $4,484 -39.4% | $147,600 -51.7% |
| 2009 | $7,399 +6% | $305,600 |
| 2007 | $6,980 +34.9% | $305,600 +78.5% |
| 2006 | $5,175 | $171,200 |
| 2005 | $5,175 | $171,200 |
Find assessor info on the county website
Monthly payment
Est. payment
Payment breakdown
Explore the cost of this home by adjusting the details. Changes won't be saved.Climate risks
Neighborhood: Elmhurst


Similar homes
- $675,0008 bd3 ba2.6k sqft614 Smith St, Providence, RI 02908For Sale

 MLS ID #1425338, Chanthrea Ou, Strive Realty. StateWide MLS RI
- $675,0006 bd3 ba2.7k sqft20-22 Violet St, Providence, RI 02908For Sale
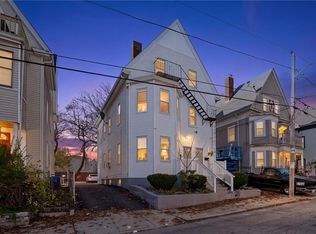 MLS ID #1428863, Robert Ciaramello, Century 21 Limitless. StateWide MLS RI
- $675,0006 bd2 ba2.3k sqft116 Jastram St, Providence, RI 02908For Sale
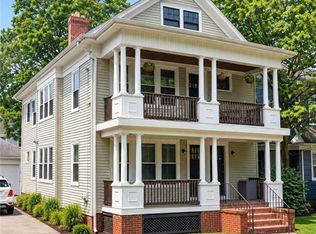 MLS ID #1425784, Chanthrea Ou, Strive Realty. StateWide MLS RI
- $675,0008 bd3 ba3.1k sqft660 Douglas Ave, Providence, RI 02908For Sale
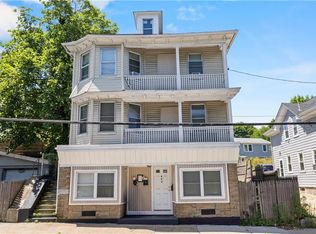 MLS ID #1426154, Kyle Seyboth, Century 21 Limitless. StateWide MLS RI
- $650,0006 bd3 ba2.8k sqft15 Sparrow St, Providence, RI 02908For SaleMLS ID #1425342, Chanthrea Ou, Strive Realty. StateWide MLS RI
- $780,0006 bd4 ba3.1k sqft319 Admiral St, Providence, RI 02908For SaleMLS ID #1425250, Suleide Vicioso, Anchor Properties. StateWide MLS RI
- $799,0006 bd3 ba2.7k sqft590 River Ave, Providence, RI 02908For SaleMLS ID #1428006, Hollie Curtis, JMG RHODE ISLAND. StateWide MLS RI
- $779,9009 bd3 ba3.4k sqft73 Farragut Ave, Cranston, RI 02905For SaleMLS ID #1429046, Jeffrey Mateus, Mateus Realty. StateWide MLS RI
- $693,0007 bd3 ba3.2k sqft1213 Smith St, Providence, RI 02908For SaleMLS ID #1422206, List with Lyon Team, HERE Realty. StateWide MLS RI
- $650,0007 bd3 ba3k sqft340 River Ave, Providence, RI 02908For SaleMLS ID #1421578, Cynthia Carlson, Regal Realty. StateWide MLS RI
- $599,0006 bd2 ba2.2k sqft81 Radcliffe Ave, Providence, RI 02908For SaleMLS ID #1425310, Chanthrea Ou, Strive Realty. StateWide MLS RI
- $699,0008 bd4 ba3k sqft88 Coggeshall St, Providence, RI 02908New ConstructionMLS ID #1423911, Sally Rianna, RE/MAX Preferred. StateWide MLS RI
- $675,0007 bd2 ba2.9k sqft230 Unit St, Providence, RI 02909For SaleMLS ID #1428939, Sherri Maestas, Century 21 Envoy. StateWide MLS RI
- $729,9008 bd3 ba3.4k sqft49 Emanuel St, North Providence, RI 02911For SaleMLS ID #1426521, Melissa Riley, Westcott Properties. StateWide MLS RI
- $699,9009 bd3 ba3.2k sqft1166 N Main St, Providence, RI 02904For SaleMLS ID #1426320, Melody Glenn, REMAX Revolution. StateWide MLS RI
- $699,9009 bd3 ba3k sqft1172 N Main St, Providence, RI 02904For SaleMLS ID #1426441, Melody Glenn, REMAX Revolution. StateWide MLS RI
- $769,0006 bd3 ba4.4k sqft1699 Elmwood Ave, Warwick, RI 02888For SaleMLS ID #1428429, Yolanda Nazario, REMAX Revolution. StateWide MLS RI
- $745,0006 bd3 ba2.5k sqft75 Doyle Ave, Providence, RI 02906For SaleMLS ID #1426886, Gerri Schiffman, Residential Properties Ltd.. StateWide MLS RI
- $759,9008 bd4 ba2.7k sqft0 Fairview St, Providence, RI 02908New ConstructionMLS ID #1424298, Samuel Albert, Innovations Realty. StateWide MLS RI
- $898,90012 bd3 ba3.7k sqft217 Carleton St, Providence, RI 02908For SaleMLS ID #1419551, Yolanda Nazario, REMAX Revolution. StateWide MLS RI
