Welcome to a newly refreshed 3 bed 2 bath home with a 2 car garage. Ample parking and generous sized lot with large back yard. Great starter home at an affordable price!
For sale
$265,000
623 N West Street, Tulare, CA 93274
3beds
1,040sqft
Single Family Residence, Residential
Built in 1962
8,277 Square Feet Lot
$262,900 Zestimate®
$255/sqft
$-- HOA
What's special
Ample parkingGenerous sized lot
- 11 days
- 1,392
- 116
Likely to sell faster than
Zillow last checked:
Listing updated:
Listed by:
Mark Campbell 559-792-7600,
Modern Broker
Source: TCMLS,MLS#: 244559
Facts & features
Interior
Bedrooms & bathrooms
- Bedrooms: 3
- Bathrooms: 2
- 3/4 bathrooms: 2
Heating
- Wall Furnace
Cooling
- Evaporative Cooling
Features
- Has fireplace: No
Interior area
- Total structure area: 1,040
- Total interior livable area: 1,040 sqft
Property
Parking
- Total spaces: 2
- Parking features: Garage
- Garage spaces: 2
Features
- Stories: 1
Lot
- Size: 8,277 Square Feet
Details
- Parcel number: 168031026000
Construction
Type & style
- Home type: SingleFamily
- Property subtype: Single Family Residence, Residential
Materials
- Roof: Composition
Condition
- New construction: No
- Year built: 1962
Utilities & green energy
- Sewer: Public Sewer
- Water: Public
- Utilities for property: Natural Gas Connected, Sewer Connected, Water Connected
Community & HOA
HOA
- Has HOA: No
Location
- Region: Tulare
Financial & listing details
- Price per square foot: $255/sqft
- Tax assessed value: $219,300
- Date on market: 10/9/2026
Estimated market value
$262,900
$250,000 - $276,000
$1,653/mo
Price history
| Date | Event | Price |
|---|---|---|
| 10/9/2026 | Listed for sale | $265,000$255/sqft |
Source:  TCMLS #244559 Report a problem | ||
Public tax history
| Year | Property taxes | Tax assessment |
|---|---|---|
| 2026 | -- | $219,300 +455.9% |
| 2025 | $354 +0.8% | $39,447 +2% |
| 2024 | $352 +3.1% | $38,675 +2% |
| 2023 | $341 +3.5% | $37,917 +2% |
| 2022 | $330 +1.8% | $37,174 +2% |
| 2021 | $324 -1.4% | $36,445 +1% |
| 2020 | $329 -2% | $36,071 +2% |
| 2019 | $335 +2.2% | $35,363 +2% |
| 2018 | $328 +1.4% | $34,670 +2% |
| 2017 | $324 +5.1% | $33,990 +2% |
| 2016 | $308 | $33,324 +1.5% |
| 2015 | $308 +4.5% | $32,824 +2% |
| 2014 | $295 | $32,181 +0.5% |
| 2013 | -- | $32,036 +2% |
| 2012 | -- | $31,408 +2% |
| 2011 | -- | $30,792 +4.6% |
| 2007 | -- | $29,445 +2% |
| 2006 | -- | $28,868 +2% |
| 2005 | -- | $28,302 +2% |
| 2004 | -- | $27,747 +1.9% |
| 2003 | -- | $27,237 +2% |
| 2002 | -- | $26,703 +2% |
| 2001 | -- | $26,180 |
Find assessor info on the county website
Monthly payment
Est. payment
Payment breakdown
Explore the cost of this home by adjusting the details. Changes won't be saved.Climate risks
Neighborhood: 93274
Similar homes
- $289,9003 bd2 ba988 sqft1129 W Tulare Avenue, Tulare, CA 93274For Sale
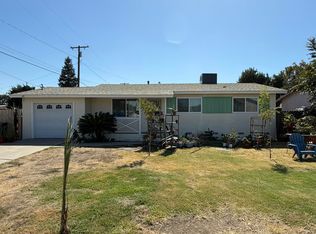 MLS ID #244603, Prudence Hudgins, Melson Realty, Inc.. TCMLS
- $--3 bd2 ba1k sqft1125 La Dawna St, Tulare, CA 93274Auction
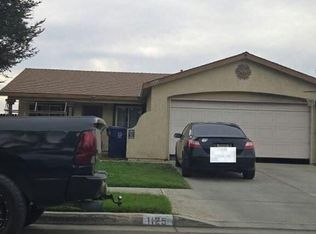 Auction.com 2
- $309,0003 bd2 ba1.3k sqft390 N Highland Street, Tulare, CA 93274For Sale
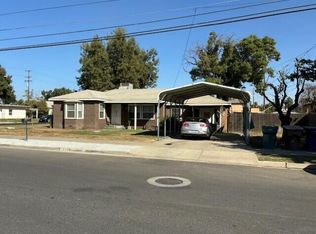 MLS ID #244669, Brian J Parreira, Craig Smith & Associates, Inc.. TCMLS
- $285,0002 bd1 ba848 sqft848 N E Street, Tulare, CA 93274For Sale
 MLS ID #244521, Gracie Guerrero-Sousa, Sousa Valley Real Estate. TCMLS
