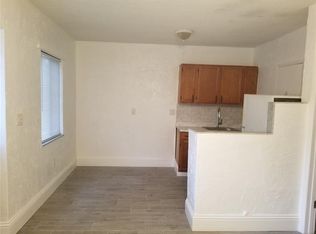
Excellent opportunity for first-time home buyers or savvy investors! This cozy and inviting 3-bedroom, 1-bathroom single-family residence features soaring vaulted ceilings, a warm, functional layout, and endless potential. Located just minutes from the beach, local parks, shopping, dining, and major commuter routes
For sale
$469,000
626 NE 4th Ct, Hallandale, FL 33009
3beds
1,040sqft
Single Family Residence
Built in 1946
-- sqft lot
$449,900 Zestimate®
$451/sqft
$-- HOA
What's special
Warm functional layoutSoaring vaulted ceilings
- 85 days
- 241
- 19
Zillow last checked:
Listing updated:
Listed by:
Yoel Lipszyc 754-736-0191,
Realty Hub
Source: MIAMI,MLS#: A12059533 Originating MLS: A-Miami Association of REALTORS
Facts & features
Interior
Bedrooms & bathrooms
- Bedrooms: 3
- Bathrooms: 1
- Full bathrooms: 1
Rooms
- Room types: Family Room
Heating
- Other
Cooling
- Ceiling Fan(s), Central Air
Appliances
- Included: Dishwasher, Dryer, Microwave, Refrigerator, Washer
- Laundry: Laundry Room
Features
- Flooring: Other
- Furnished: Yes
Interior area
- Total structure area: 1,082
- Total interior livable area: 1,040 sqft
Video & virtual tour
Property
Parking
- Parking features: Driveway
- Has uncovered spaces: Yes
Features
- Stories: 1
- Entry location: First Floor Entry
- Pool features: R30-No Pool/No Water
- Fencing: Fenced
- View description: None
Lot
- Features: East Of US 1
Details
- Parcel number: 514222130210
- Zoning: CENTRAL
Construction
Type & style
- Home type: SingleFamily
- Property subtype: Single Family Residence
Materials
- Concrete Block Construction
- Roof: Other
Condition
- Year built: 1946
Utilities & green energy
- Sewer: Public Sewer
- Water: Municipal Water
Community & HOA
Community
- Features: None, No Subdiv/Park Info
- Subdivision: Atlantic Shores Dixie Hig
HOA
- Has HOA: No
Location
- Region: Hallandale
Financial & listing details
- Price per square foot: $451/sqft
- Tax assessed value: $487,870
- Annual tax amount: $9,436
- Date on market: 7/27/2026
Estimated market value
$449,900
$427,000 - $472,000
$3,047/mo
Price history
| Date | Event | Price |
|---|---|---|
| 9/8/2026 | Price change | $2,770-6.9%$3/sqft |
Source:  MIAMI #A12060485 Report a problem | ||
| 9/7/2026 | Listed for sale | $469,000-4.1%$451/sqft |
Source: MIAMI #A12059533 Report a problem | ||
| 8/12/2026 | Listing removed | $489,000+22.3%$470/sqft |
Source: MIAMI #A12059533 Report a problem | ||
| 7/27/2026 | Listed for rent | $2,975-13.8%$3/sqft |
Source: MIAMI #A12060485 Report a problem | ||
| 9/10/2024 | Listing removed | $3,450$3/sqft |
Source: Zillow Rentals Report a problem | ||
| 5/29/2024 | Price change | $3,450-6.8%$3/sqft |
Source: Zillow Rentals Report a problem | ||
| 5/17/2024 | Listed for rent | $3,700$4/sqft |
Source: Zillow Rentals Report a problem | ||
| 10/5/2023 | Listing removed | -- |
Source: Zillow Rentals Report a problem | ||
| 7/18/2023 | Listed for rent | $3,700$4/sqft |
Source: Zillow Rentals Report a problem | ||
| 7/8/2023 | Listing removed | -- |
Source: Zillow Rentals Report a problem | ||
| 7/7/2023 | Listed for rent | $3,700-5.1%$4/sqft |
Source: Zillow Rentals Report a problem | ||
| 4/5/2022 | Listing removed | -- |
Source: Zillow Rental Network_1 Report a problem | ||
| 3/29/2022 | Listed for rent | $3,900$4/sqft |
Source: Zillow Rental Network_1 Report a problem | ||
| 8/30/2021 | Sold | $400,000-11.1%$385/sqft |
Source: MIAMI #A11063298 Report a problem | ||
| 7/14/2021 | Price change | $450,000+4.7%$433/sqft |
Source: MIAMI #A11063298 Report a problem | ||
| 6/28/2021 | Listed for sale | $430,000+30.3%$413/sqft |
Source: MIAMI #A11063298 Report a problem | ||
| 6/18/2021 | Sold | $330,000-2.7%$317/sqft |
Source: MIAMI #A11009751 Report a problem | ||
| 5/4/2021 | Contingent | $339,000$326/sqft |
Source: MIAMI #A11009751 Report a problem | ||
| 5/3/2021 | Listed for sale | $339,000$326/sqft |
Source: MIAMI #A11009751 Report a problem | ||
| 3/25/2021 | Contingent | $339,000$326/sqft |
Source: MIAMI #A11009751 Report a problem | ||
| 3/8/2021 | Listed for sale | $339,000+41.3%$326/sqft |
Source: MIAMI #A11009751 Report a problem | ||
| 11/30/2020 | Sold | $240,000-10.8%$231/sqft |
Source: MIAMI #A10939000 Report a problem | ||
| 10/30/2020 | Pending sale | $269,000$259/sqft |
Source: Godoy Realty LLC #A10939000 Report a problem | ||
| 10/20/2020 | Price change | $269,000-3.6%$259/sqft |
Source: Godoy Realty LLC #A10939000 Report a problem | ||
| 10/11/2020 | Price change | $279,000-0.4%$268/sqft |
Source: Godoy Realty LLC #A10939000 Report a problem | ||
| 9/28/2020 | Listed for sale | $279,983+30.2%$269/sqft |
Source: Owner Report a problem | ||
| 5/11/2016 | Sold | $215,000-25.2%$207/sqft |
Source: Public Record Report a problem | ||
| 8/30/2013 | Sold | $287,500+827.4%$276/sqft |
Source: Agent Provided Report a problem | ||
| 7/29/1996 | Sold | $31,000+244.4%$30/sqft |
Source: Public Record Report a problem | ||
| 5/1/1984 | Sold | $9,000$9/sqft |
Source: Public Record Report a problem | ||
Public tax history
| Year | Property taxes | Tax assessment |
|---|---|---|
| 2025 | $10,433 -0.6% | $487,870 +5.7% |
| 2024 | $10,493 +2.4% | $461,520 +10% |
| 2023 | $10,245 +21.8% | $419,570 +10% |
| 2022 | $8,413 +78.3% | $381,430 +76% |
| 2021 | $4,718 +29.4% | $216,770 +5.3% |
| 2020 | $3,645 +2% | $205,940 +2.3% |
| 2019 | $3,573 | $201,310 +1.9% |
| 2018 | $3,573 +7.4% | $197,560 +2.1% |
| 2017 | $3,327 +7.8% | $193,500 +60% |
| 2016 | $3,086 +12.3% | $120,930 +10% |
| 2015 | $2,749 +31.6% | $109,940 +10% |
| 2014 | $2,089 | $99,950 +19.5% |
| 2013 | $2,089 +39.3% | $83,650 +25% |
| 2012 | $1,500 -23.5% | $66,910 -25% |
| 2011 | $1,961 -4% | $89,250 |
| 2010 | $2,043 -13.7% | $89,250 -16.1% |
| 2009 | $2,366 -14.1% | $106,330 -20.3% |
| 2008 | $2,756 -19.8% | $133,350 -19.9% |
| 2007 | $3,437 +9.9% | $166,530 +21.8% |
| 2006 | $3,128 | $136,670 +24.8% |
| 2005 | -- | $109,510 +39.8% |
| 2004 | $1,995 -0.7% | $78,320 +1.8% |
| 2003 | $2,009 +1.1% | $76,900 +1.3% |
| 2002 | $1,988 +78.1% | $75,880 +80.4% |
| 2001 | $1,116 +1.7% | $42,070 |
| 2000 | $1,098 | -- |
Find assessor info on the county website
Monthly payment
Est. payment
Payment breakdown
Explore the cost of this home by adjusting the details. Changes won't be saved.Climate risks
Neighborhood: 33009
Similar homes
- $645,0003 bd2 ba1.1k sqftGulfstream Estates, Hallandale Beach, FL 33009For Sale
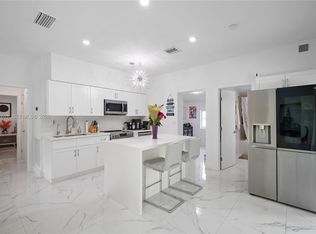
 MLS ID #A12097611, Joel Arguello, Rev Realty Group, LLC.. MIAMI
- $534,9003 bd2 ba1k sqftBelmar Amended, Hollywood, FL 33020For Sale
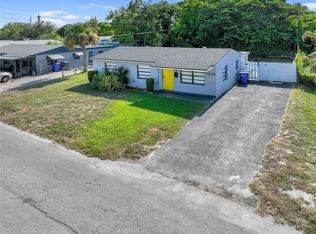 MLS ID #A12073601, Maria Agudelo, United Realty Group Inc. MIAMI
- $--2 bd2 ba1k sqft3760 SW 47th Ave, West Park, FL 33023Auction
 Auction.com 2
- $599,0003 bd2 ba1.3k sqftRo-Len Acres 1st Add, Hallandale Beach, FL 33009For Sale
 MLS ID #A12059169, Andrea Settembrino, The Firm Realty Group. MIAMI
- $485,0003 bd2 ba1.4k sqftSouth Hollywood Amd Plat, Hollywood, FL 33020For SaleMLS ID #A12061739, Leonard Gilbert, Lifestyle International Realty. MIAMI
- $495,0003 bd2 ba1.1k sqftJudy Manors, North Miami Beach, FL 33162For SaleMLS ID #A12102804, Julia Poliadis, One Sotheby's International Realty. MIAMI
- $489,9004 bd3 ba1k sqftLiberia, Hollywood, FL 33020For SaleMLS ID #A11941720, Adam Lenz, Lokation. MIAMI
- $543,0004 bd2 ba1.1k sqftWilkes-Barre Park, Hollywood, FL 33020For SaleMLS ID #A12075119, Alexandra Jordan, Bellisimo Realty, LLC. MIAMI
- $405,0003 bd2 ba872 sqftCresthaven No 2, Hollywood, FL 33023For SaleMLS ID #A12060051, Diego Kogutek, Horizon Homes Realty Corp. MIAMI
- $475,0003 bd1 ba851 sqftBoulevard Estates, Hollywood, FL 33024For SaleMLS ID #A12030485, Nomaira Shahzadi, Lifestyle International Realty. MIAMI
- $430,0003 bd2 ba1k sqftSun Land Park, Miramar, FL 33023For SaleMLS ID #A11809631, Samuel Fugina, Marlin Realty Inc. MIAMI
- $510,0003 bd2 ba1.1k sqftBoulevard Heights Sec 4, Hollywood, FL 33024For SaleMLS ID #A12080960, Erika Zambrano, United Realty Group Inc.. MIAMI
- $470,0003 bd2 ba955 sqftCrestwood, Miami, FL 33127For SaleMLS ID #A12073221, Emanuel Martinez, Epic Choice Realty. MIAMI
- $434,9002 bd1 ba884 sqftDriftwood Acres No 6, Hollywood, FL 33024For SaleMLS ID #A12064277, Raul Lopez, LPT Realty, LLC. MIAMI
- $465,0003 bd2 ba1k sqftCollier Estates 1st Add, Fort Lauderdale, FL 33334For SaleMLS ID #A12061773, Lindsay Garcia, Redfin Corporation. MIAMI
- $469,9003 bd2 ba1.1k sqftSan Mateo, Hialeah, FL 33015For SaleMLS ID #A12100537, Odalys Luis, JPM Realty Advisors, LLC. MIAMI
- $499,0004 bd2 ba1k sqftBrendale Heights, Fort Lauderdale, FL 33312For SaleMLS ID #A12045629, Carlos Rivero, RE/MAX Advance Realty II. MIAMI
- $525,0003 bd2 ba1.5k sqftDriftwood Plaza Add, Hollywood, FL 33024For SaleMLS ID #A12100255, Yulieth Pena-Mesa, New Emporium Properties, Inc.. MIAMI
- $475,0003 bd2 ba1.5k sqftVillas Lakes, Pembroke Pines, FL 33026For SaleMLS ID #A12108112, Joel Milian, Canvas Real Estate. MIAMI
