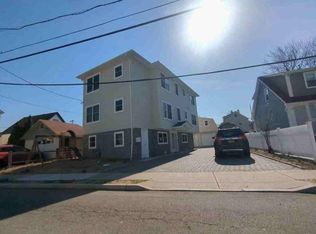
Whether you are looking to expand your real estate portfolio or secure a property that offers additional financial flexibility, this is an opportunity worth exploring! Featuring two spacious residential units, each offering 2 bedrooms and 1 full bath, this property presents an ideal opportunity for both owner-occupants and investors alike. This property also provides a finished basement detached garage space and backyard. Ideally situated near local shopping, restaurants, schools, parks, and convenient transportation.
For sale
$649,000
63 Locust Avenue, Wallington, NJ 07057
4beds
--sqft
Multi Family
Built in ----
-- sqft lot
$-- Zestimate®
$--/sqft
$-- HOA
What's special
Detached garage spaceFinished basementTwo spacious residential units
- 10 hours
- 131
- 5
Zillow last checked:
Listing updated:
Listed by:
Frank Capoano 201-522-7621,
EXP Realty, LLC
Source: NJMLS,MLS#: 26042473
Facts & features
Interior
Bedrooms & bathrooms
- Bedrooms: 4
- Bathrooms: 3
- Full bathrooms: 3
Appliances
- Laundry: In Basement
Property
Details
- Parcel number: 6500037000000033
Construction
Type & style
- Home type: MultiFamily
- Property subtype: Multi Family
Utilities & green energy
- Utilities for property: Electricity Connected
Community & HOA
Location
- Region: Wallington
Financial & listing details
- Tax assessed value: $560,300
- Annual tax amount: $10,925
- Date on market: 11/17/2026
- Listing agreement: Exclusive Right To Sell
Estimated market value
Not available
Estimated sales range
Not available
Not available
Price history
| Date | Event | Price |
|---|---|---|
| 11/17/2026 | Listed for sale | $649,000+180.2% |
Source:  NJMLS #26042473 Report a problem | ||
| 2/25/2003 | Sold | $231,600 |
Source: Public Record Report a problem | ||
Public tax history
| Year | Property taxes | Tax assessment |
|---|---|---|
| 2026 | $10,926 -42.7% | $560,300 |
| 2025 | $19,056 +119.3% | $560,300 +119.3% |
| 2024 | $8,690 +3.9% | $255,500 |
| 2023 | $8,360 +2.1% | $255,500 |
| 2022 | $8,186 +1.7% | $255,500 |
| 2021 | $8,046 +5.4% | $255,500 |
| 2020 | $7,632 +1.2% | $255,500 |
| 2019 | $7,542 | $255,500 |
| 2018 | $7,542 +3.3% | $255,500 |
| 2017 | $7,302 +4.5% | $255,500 |
| 2016 | $6,990 +5.4% | $255,500 |
| 2015 | $6,633 -6% | $255,500 |
| 2014 | $7,053 +6.4% | $255,500 -20.1% |
| 2013 | $6,627 | $319,700 |
| 2012 | $6,627 -2% | $319,700 |
| 2011 | $6,760 +4.1% | $319,700 -13.1% |
| 2010 | $6,492 +4.3% | $368,000 |
| 2009 | $6,223 | $368,000 +190.7% |
| 2007 | -- | $126,600 |
| 2006 | -- | $126,600 |
| 2005 | -- | $126,600 |
| 2004 | -- | $126,600 |
| 2003 | -- | $126,600 |
| 2002 | -- | $126,600 |
| 2001 | -- | $126,600 |
Find assessor info on the county website
Monthly payment
Est. payment
Payment breakdown
Explore the cost of this home by adjusting the details. Changes won't be saved.Climate risks
Neighborhood: 07057


Similar homes
- $849,9004 bd2 ba2.6k sqft36 Pulaski Ave, Wallington, NJ 07057Auction
 Hubzu REO
- $724,9004 bd3 ba-- sqft15 Anderson Avenue, Wallington, NJ 07057For Sale
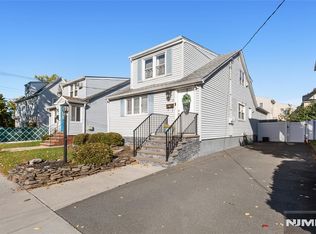
 MLS ID #26039477, Zoila Barzaga, RE/MAX Trading Places LLC - Hasbrouck Heights. NJMLS
- $589,9004 bd2 ba-- sqft360 River Drive, Garfield City, NJ 07026For Sale
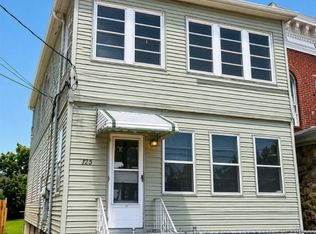 MLS ID #4065133, Nancy Rodriguez, Nicholas Real Estate Agency. GSMLS
- $649,9006 bd2 ba3.3k sqft67 Van Buren St, Passaic City, NJ 07055For Sale
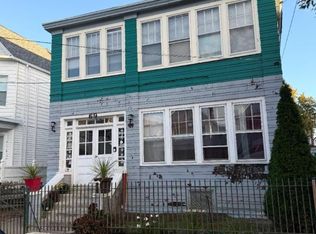 MLS ID #4063808, Monica Martinez, Elite Realtors Of New Jersey. GSMLS
- $689,9004 bd3 ba-- sqft384 Main Avenue, Wallington, NJ 07057For SaleMLS ID #26035348, Carlos Salazar, Jr., Coldwell Banker, Fort Lee. NJMLS
- $649,0004 bd3 ba-- sqft64 Atkins Terrace, East Rutherford, NJ 07073For SaleMLS ID #26042309, Bobby Ristovski, Coccia Realty Better Homes & Gardens-Rutherford. NJMLS
- $899,0004 bd3 ba-- sqft69 Main Avenue, Wallington, NJ 07057For SaleMLS ID #26028930, Christina Tolen, Weichert Realtors, Ridgewood. NJMLS
- $675,0003 bd4 ba-- sqft64 Palisade Avenue, Garfield, NJ 07026For SaleMLS ID #26041031, Halina Strzepek, LPT Realty. NJMLS
- $649,5554 bd2 ba-- sqft341 Grove Street, East Rutherford, NJ 07073For SaleMLS ID #26033889, Maria Bonsignore, Keller Williams Park Views. NJMLS
- $649,1116 bd2 ba-- sqft322 River Drive, Garfield, NJ 07026For SaleMLS ID #26041173, Tiffany Lee Hill, RE/MAX SELECT - Franklin Lakes. NJMLS
