This 1232 square foot single family home has 3 bedrooms and 2.0 bathrooms. This home is located at 630 N Quincy Rd, Turlock, CA 95380.
Pre-foreclosure
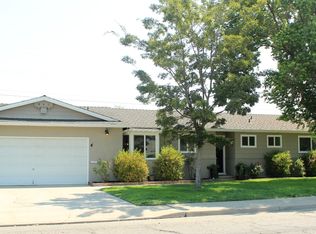
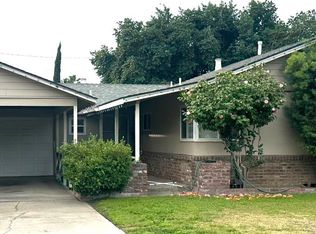
Street View
Est. $427,600
630 N Quincy Rd, Turlock, CA 95380
3beds
2baths
1,232sqft
SingleFamily
Built in 1963
6,969 Square Feet Lot
$427,600 Zestimate®
$347/sqft
$-- HOA
Overview
- 99 days |
- 47 |
- 2 |
Facts & features
Interior
Bedrooms & bathrooms
- Bedrooms: 3
- Bathrooms: 2
Heating
- Other
Cooling
- Central
Features
- Has fireplace: Yes
Interior area
- Total interior livable area: 1,232 sqft
Property
Parking
- Total spaces: 2
- Parking features: Garage - Attached
Lot
- Size: 6,969 Square Feet
Details
- Parcel number: 051007019000
Construction
Type & style
- Home type: SingleFamily
Materials
- wood frame
Condition
- Year built: 1963
Community & HOA
Location
- Region: Turlock
Financial & listing details
- Price per square foot: $347/sqft
- Tax assessed value: $115,459
- Annual tax amount: $1,167
Visit our professional directory to find a foreclosure specialist in your area that can help with your home search.
Find a foreclosure agentForeclosure details
Estimated market value
$427,600
$393,000 - $458,000
$2,399/mo
Price history
Price history is unavailable.
Public tax history
| Year | Property taxes | Tax assessment |
|---|---|---|
| 2025 | $1,167 +2% | $115,459 +2% |
| 2024 | $1,144 +0.3% | $113,196 +2% |
| 2023 | $1,141 +1.4% | $110,977 +2% |
| 2022 | $1,125 +1.6% | $108,802 +2% |
| 2021 | $1,107 +0.8% | $106,670 +1% |
| 2020 | $1,098 +1.8% | $105,577 +2% |
| 2019 | $1,079 +0.2% | $103,508 +2% |
| 2018 | $1,076 +2.5% | $101,480 +2% |
| 2017 | $1,050 +7.2% | $99,491 +2% |
| 2016 | $979 +2.2% | $97,541 +1.5% |
| 2015 | $958 | $96,077 +2% |
| 2014 | $958 | $94,196 +4.5% |
| 2012 | -- | $90,132 |
| 2011 | -- | $90,132 +0.8% |
| 2010 | -- | $89,459 -0.2% |
| 2009 | -- | $89,671 +2% |
| 2008 | -- | $87,914 +2% |
| 2007 | -- | $86,191 +2% |
| 2006 | -- | $84,502 +2% |
| 2005 | -- | $82,846 +2% |
| 2004 | $802 +4% | $81,222 +1.9% |
| 2003 | $771 | $79,734 +2% |
| 2002 | -- | $78,170 +2% |
| 2001 | $744 +1.6% | $76,637 +2% |
| 2000 | $732 | $75,134 |
Find assessor info on the county website
Monthly payment
Estimated monthly payment$1,822
All calculations are estimates and provided by Zillow, Inc. for informational purposes only. Actual amounts may vary.
HOA fees may include property taxes on listings classified as Co-Ops. Contact the listing agent and/or owner for fee details.
Mortgage interest rates are dependent on a number of factors, including credit score, down payment, and repayment length. Interest rate data provided by Zillow Group Marketplace, Inc. as of 1/1/1970 from various mortgage lenders with which we have lead or other similar arrangements; the Estimated Payment is an average of those rates.
See how much you could borrow to make a competitive offer.
Climate risks
Neighborhood: 95380
Nearby schools
GreatSchools rating
- 4/10Julien Elementary SchoolGrades: K-6Distance: 0.4 mi
- 7/10Marvin A. Dutcher Middle SchoolGrades: 6-8Distance: 1 mi
- 7/10Turlock High SchoolGrades: 9-12Distance: 0.5 mi


- California
- Stanislaus County
- Turlock
- 95380
- 630 N Quincy Rd
Nearby cities
Nearby zip codes
Other Turlock Topics
