Skip main navigation
Off market
Street View
  • $188,900

    6301 N Sheridan Rd APT 20D, Chicago, IL 60660

    --beds
    --baths
    --sqft
    Condo
    Built in 1967
    -- sqft lot
    $188,900 Zestimate®
    $--/sqft
    $1,922 Estimated rent

    Home value

    $188,900

    $178,000 - $200,000

    $1,922/mo

    Zestimate® history
    Loading
    Loading...

    Owner options

    List your home for rent

    $1,922/mo

    Rent Zestimate®

    Find your next renter with Zillow Rental Manager. Plus, with online applications, you can quickly screen prospective tenants – for free.

    Learn more

    $1,922/mo

    Rent Zestimate®

    Refinance and save

    $1,902/mo

    Est. payment

    Refinancing to a lower rate could help reduce your monthly payments and save thousands over the life of the loan.

    See today's rates

    $1,902/mo

    Est. payment

    Explore your selling options

    Work with a Zillow partner agent

    Leverage their expertise and Zillow's premium Showcase listings to get your home seen by more buyers.

    Get started

    List with your own agent

    Get your home in front of millions of buyers by listing it on Zillow.

    Learn how to do it

    Sell it yourself

    Take full control of how buyers see your home on Zillow by listing For Sale by Owner (FSBO).

    List your home

    What's special

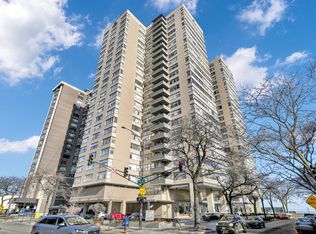
    This is a condo home. This home is located at 6301 N Sheridan Rd APT 20D, Chicago, IL 60660.

    This property is off market, which means it's not currently listed for sale or rent on Zillow. This may be different from what's available on other websites or public sources.

    Facts & features

    Property

    Lot
    • Size: 1.23 Acres
    Details
    • Parcel number: 14052030111279

    Construction

    Type & style
    • Home type: Condo
    Condition
    • Year built: 1967

    Community & neighborhood

    Location
    • Region: Chicago

    HOA & financial

    HOA
    • Has HOA: Yes
    • HOA fee: $516 monthly

    Price history

    DateEventPrice
    4/11/2025Listing removed$185,000
    Source: MRED as distributed by MLS GRID #12320465 Report a problem
    4/8/2025Listed for sale$185,000
    Source: MRED as distributed by MLS GRID #12320465 Report a problem
    6/1/2023Sold$185,000+2.8%
    Source: MRED as distributed by MLS GRID #11746309 Report a problem
    4/6/2023Contingent$180,000
    Source: MRED as distributed by MLS GRID #11746309 Report a problem
    3/28/2023Listed for sale$180,000-4.8%
    Source: MRED as distributed by MLS GRID #11746309 Report a problem
    3/28/2023Listing removed--
    Source: MRED as distributed by MLS GRID #11706767 Report a problem
    1/25/2023Listed for sale$189,000+110%
    Source: MRED as distributed by MLS GRID #11706767 Report a problem
    10/3/2022Sold$90,000-5.3%
    Source: MRED as distributed by MLS GRID #11463172 Report a problem
    8/10/2022Pending sale$95,000
    Source: MRED as distributed by MLS GRID #11463172 Report a problem
    7/22/2022Contingent$95,000
    Source: MRED as distributed by MLS GRID #11463172 Report a problem
    7/13/2022Listed for sale$95,000-26.9%
    Source: MRED as distributed by MLS GRID #11463172 Report a problem
    10/5/2004Sold$130,000+11.1%
    Source: Public Record Report a problem
    2/24/2003Sold$117,000+105.3%
    Source: Public Record Report a problem
    7/10/1998Sold$57,000+67.6%
    Source: Public Record Report a problem
    12/15/1995Sold$34,000
    Source: Public Record Report a problem

    Public tax history

    YearProperty taxesTax assessment
    2024-- $12,917 +7.7%
    2023$2,532 +2.6%$11,999
    2022$2,468 +2.3%$11,999
    2021$2,413 +12.3%$11,999 +24.5%
    2020$2,148 +0.2%$9,641 -9.6%
    2019$2,144 +1.7%$10,669
    2018$2,107 +13.3%$10,669 +23.5%
    2017$1,860 +7.5%$8,639
    2016$1,730 +9.3%$8,639
    2015$1,583 +26.2%$8,639 +27.8%
    2014$1,255 +2%$6,762
    2013$1,230 -18.9%$6,762 -20%
    2012$1,517 -3.4%$8,453 -12.7%
    2011$1,570 -13.9%$9,686 -13.6%
    2010$1,824 -10.2%$11,208 -14%
    2009$2,032 +9.2%$13,029 +0.4%
    2008$1,861 +1%$12,973
    2007$1,842 -1.1%$12,973
    2006$1,862 +0.9%$12,973 +14.9%
    2005$1,845 +1%$11,292
    2004$1,827 +2.2%$11,292
    2003$1,787 +45.1%$11,292 +64.8%
    2002$1,231 +47.2%$6,852
    2001$836 +102.5%$6,852
    2000$413 +2.4%$6,852 +65.1%
    1999$403 $4,149

    Find assessor info on the county website

    Neighborhood: Edgewater

    Nearby schools

    GreatSchools rating
    Get a cash offer in 3 minutes
    Find out how much your home could sell for in as little as 3 minutes with a no-obligation cash offer.
    Estimated market value
    $188,900
    Get a cash offer in 3 minutes
    Find out how much your home could sell for in as little as 3 minutes with a no-obligation cash offer.
    Estimated market value
    $188,900