Excellent opportunity for investors or first-time homebuyers! This 3-bedroom, 2-bathroom home is conveniently located in Miami, with easy access to major highways, downtown Miami, shopping centers, restaurants, and other nearby conveniences. Great potential for homeowners or investors looking to add to their portfolio. Don't miss this opportunity to own a property in a convenient Miami location!
For sale
$449,000
6306 NW 19th Ct, Miami, FL 33147
3beds
1,110sqft
Single Family Residence
Built in 2006
3,500 Square Feet Lot
$-- Zestimate®
$405/sqft
$-- HOA
What's special
- 16 days
- 691
- 68
Likely to sell faster than
Zillow last checked:
Listing updated:
Listed by:
Antonio Aguiar 786-602-3365,
Horizon Homes Realty Corp
Source: MIAMI,MLS#: A12107779 Originating MLS: A-Miami Association of REALTORS
Facts & features
Interior
Bedrooms & bathrooms
- Bedrooms: 3
- Bathrooms: 2
- Full bathrooms: 2
Rooms
- Room types: Family Room
Heating
- None
Cooling
- Central Air
Appliances
- Included: Dishwasher, Refrigerator
- Laundry: Laundry Room
Features
- Walk-In Closet(s)
- Flooring: Vinyl
Interior area
- Total structure area: 1,110
- Total interior livable area: 1,110 sqft
Video & virtual tour
Property
Parking
- Parking features: Driveway
- Has uncovered spaces: Yes
Features
- Stories: 1
- Pool features: R30-No Pool/No Water
- Fencing: Fenced
- View description: None
Lot
- Size: 3,500 Square Feet
- Features: Less Than 1/4 Acre Lot
Details
- Parcel number: 3031150100060
- Zoning: 5700
Construction
Type & style
- Home type: SingleFamily
- Property subtype: Single Family Residence
Materials
- CBS Construction
- Roof: Shingle
Condition
- Year built: 2006
Utilities & green energy
- Sewer: Public Sewer
- Water: Municipal Water
Community & HOA
Community
- Features: None, No Subdiv/Park Info
- Subdivision: Bullards
HOA
- Has HOA: No
Location
- Region: Miami
Financial & listing details
- Price per square foot: $405/sqft
- Tax assessed value: $267,536
- Annual tax amount: $5,043
- Date on market: 10/27/2026
- Listing terms: All Cash,Conventional,FHA
Estimated market value
Not available
Estimated sales range
Not available
Not available
Price history
| Date | Event | Price |
|---|---|---|
| 10/27/2026 | Listed for sale | $449,000+47.2%$405/sqft |
Source:  MIAMI #A12107779 Report a problem | ||
| 7/15/2026 | Sold | $305,000-12.1%$275/sqft |
Source: Public Record Report a problem | ||
| 6/13/2026 | Listing removed | $2,300$2/sqft |
Source: Zillow Rentals Report a problem | ||
| 5/26/2026 | Listed for rent | $2,300+9.5%$2/sqft |
Source: Zillow Rentals Report a problem | ||
| 9/3/2024 | Sold | $347,000-18.4%$313/sqft |
Source: MIAMI #A11610184 Report a problem | ||
| 8/8/2024 | Pending sale | $425,000$383/sqft |
Source: MIAMI #A11610184 Report a problem | ||
| 7/17/2024 | Contingent | $425,000$383/sqft |
Source: MIAMI #A11610184 Report a problem | ||
| 6/26/2024 | Listed for sale | $425,000+286.4%$383/sqft |
Source: MIAMI #A11610184 Report a problem | ||
| 2/14/2022 | Listing removed | -- |
Source: Zillow Rental Network_1 Report a problem | ||
| 10/15/2021 | Listed for rent | $2,100$2/sqft |
Source: Zillow Rental Network_1 Report a problem | ||
| 10/29/2014 | Sold | $110,000+11.1%$99/sqft |
Source: Public Record Report a problem | ||
| 11/1/2013 | Listing removed | $99,000$89/sqft |
Source: RE/MAX Gold #A1720394 Report a problem | ||
| 10/11/2013 | Listed for sale | $99,000$89/sqft |
Source: RE/MAX Gold #A1720394 Report a problem | ||
| 6/4/2013 | Listing removed | $99,000$89/sqft |
Source: RE/MAX Gold #A1720394 Report a problem | ||
| 1/26/2013 | Price change | $99,000-16.8%$89/sqft |
Source: Avant Realty Group LLC #A1720394 Report a problem | ||
| 11/6/2012 | Price change | $119,000+20.2%$107/sqft |
Source: Avant Realty Group LLC #A1619721 Report a problem | ||
| 6/17/2012 | Price change | $99,000-17.4%$89/sqft |
Source: Avant Realty Group LLC #A1619721 Report a problem | ||
| 6/6/2012 | Price change | $119,900+21.1%$108/sqft |
Source: Avant Realty Group LLC #A1619721 Report a problem | ||
| 3/23/2012 | Listed for sale | $99,000+97.6%$89/sqft |
Source: Avant Realty Group LLC #A1619721 Report a problem | ||
| 11/8/2011 | Sold | $50,100+0.4%$45/sqft |
Source: Public Record Report a problem | ||
| 9/14/2011 | Listed for sale | $49,900+147%$45/sqft |
Source: ONE SOURCE REALTY GROUP, LLC. #A1548550 Report a problem | ||
| 8/19/2011 | Sold | $20,200-90.4%$18/sqft |
Source: Public Record Report a problem | ||
| 7/10/2006 | Sold | $210,000+2233.3%$189/sqft |
Source: Public Record Report a problem | ||
| 4/6/2004 | Sold | $9,000$8/sqft |
Source: Public Record Report a problem | ||
Public tax history
| Year | Property taxes | Tax assessment |
|---|---|---|
| 2025 | $5,253 +16.7% | $267,536 +34.1% |
| 2024 | $4,503 +8.3% | $199,559 +10% |
| 2023 | $4,158 +11.5% | $181,418 +10% |
| 2022 | $3,729 +14.8% | $164,926 +10% |
| 2021 | $3,249 +8.4% | $149,933 +10% |
| 2020 | $2,997 +5.8% | $136,303 +10% |
| 2019 | $2,833 +16.2% | $123,912 +10% |
| 2018 | $2,437 | $112,648 +10% |
| 2017 | $2,437 +5.5% | $102,408 +10% |
| 2016 | $2,310 +8.4% | $93,099 +1.5% |
| 2015 | $2,131 +27.1% | $91,710 +41.7% |
| 2014 | $1,676 +3.3% | $64,728 +10% |
| 2013 | $1,622 | $58,844 -6.5% |
| 2012 | $1,622 -6.1% | $62,931 -7.5% |
| 2011 | $1,728 -27.5% | $68,024 -27.7% |
| 2010 | $2,383 -2.2% | $94,058 -10.4% |
| 2009 | $2,436 -19.4% | $104,995 -24% |
| 2007 | $3,023 +1333.1% | $138,198 |
| 2001 | $211 | -- |
Find assessor info on the county website
Monthly payment
Est. payment
Payment breakdown
Explore the cost of this home by adjusting the details. Changes won't be saved.Climate risks
Neighborhood: 33147
Similar homes
- $415,0003 bd2 ba740 sqftLiberty City, Miami, FL 33147For Sale

 MLS ID #A12110929, Dennis Diaz, 4ever Homes Realty LLC. MIAMI
- $460,0003 bd2 ba1k sqftPara Villa Heights, Miami, FL 33147For Sale
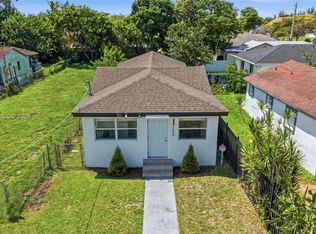 MLS ID #A12085913, Amanda Dorronsoro Sanchez, LPT Realty, LLC. MIAMI
- $425,0004 bd2 ba970 sqftLiberty City, Miami, FL 33147For Sale
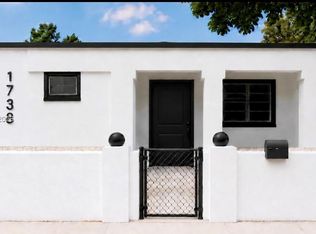 MLS ID #A12098652, Shirlee Fernandez, Coldwell Banker Realty. MIAMI
- $425,0003 bd2 ba790 sqftLiberty City, Miami, FL 33147For Sale
 MLS ID #A12071702, Diego Kogutek, Horizon Homes Realty Corp. MIAMI
- $426,0004 bd2 ba912 sqftLiberty City, Miami, FL 33147For SaleMLS ID #A12040659, Miguel Taberna, Casamia Realty Group LLC. MIAMI
- $420,0004 bd2 ba1.3k sqftLiberty City, Miami, FL 33147For SaleMLS ID #A12089309, Lucila Ursztein, BM2 Realty. MIAMI
- $399,0003 bd2 ba1.3k sqftLiberty City, Miami, FL 33147For SaleMLS ID #A12016245, Olga Formoso, Platinum Properties Int'l Inc.. MIAMI
- $457,0003 bd1 ba1k sqftLittle River Gardens, Miami, FL 33147For SaleMLS ID #A12087559, Rogerlee Vidal, Navigate Real Estate, LLC.. MIAMI
- $500,0003 bd2 ba1.2k sqftLee Hgts, Miami, FL 33147For SaleMLS ID #A12070240, Moises Meza, Realty One Group Evolution. MIAMI
- $485,0003 bd2 ba1.1k sqftNorth Liberty City Amd, Miami, FL 33147For SaleMLS ID #A12099882, Rafael Goicouria, Keller Williams Elite Properties. MIAMI
- $475,0002 bd1 ba1.2k sqftOrange View Park, Miami, FL 33147For SaleMLS ID #A11879896, Miguel Angel Ramirez, Mike Ramirez Real Estate Corporation. MIAMI
- $509,0002 bd3 ba1.2k sqftOrange Ridge Ct, Miami, FL 33142For SaleMLS ID #A12117143, Victoria Harwood, Keller Williams Realty Miami Beach. MIAMI
- $525,0003 bd2 ba1k sqftFloral Pk, Miami, FL 33142For SaleMLS ID #A12121922, Mickael Jarrige PA, Charles Rutenberg Realty FTL. MIAMI
- $349,9993 bd1 ba1.2k sqftRev Pl W Little River, Miami, FL 33147For SaleMLS ID #A12121613, Joshua Rivera, Top Tier International Realty, LLC.. MIAMI
- $435,0002 bd2 ba822 sqftStephen Manor, Miami, FL 33150For SaleMLS ID #A12118677, Caydri Cherie Piedra, Keller Williams Realty Premier Properties. MIAMI
- $566,9003 bd2 ba1.1k sqftPara Villa Heights, Miami, FL 33147For SaleMLS ID #A12098797, Federica Zanti, Federica Zanti, Broker. MIAMI
- $389,9994 bd2 ba1.4k sqftPara Villa Heights, Miami, FL 33147For SaleMLS ID #A12040202, Luigui Ferrer, Smart Miami Realty, LLC.. MIAMI
- $449,0005 bd3 ba1.4k sqftAvocado Park, Miami, FL 33147For SaleMLS ID #A12099143, Myriam Cambronne, MAC Miami Realty Group, LLC.. MIAMI
- $370,0003 bd2 ba752 sqftOrange View Pk, Miami, FL 33147For SaleMLS ID #A11568876, Jonathan Minerick, HomeCoin.com. MIAMI
- $494,0003 bd2 ba1.4k sqftComm Liberty City, Miami, FL 33147For SaleMLS ID #A11856312, Carol Fernandez, Experience Real Estate Group. MIAMI
