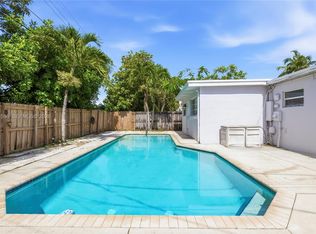
Property is completely renovated. New roof, new kitchen, new bathroom, new floors, new window blinds, new fence. It's currently rented for 3,050 with lease ending in February 28th 2027 . Please let me know if you'd like to schedule a showing.
For sale
$465,000
631 NE 57th St, Fort Lauderdale, FL 33334
3beds
998sqft
Single Family Residence
Built in 1960
6,007 Square Feet Lot
$-- Zestimate®
$466/sqft
$-- HOA
What's special
Completely renovatedNew window blindsNew roofNew bathroomNew kitchenNew floorsNew fence
- 8 days
- 141
- 7
Likely to sell faster than
Zillow last checked:
Listing updated:
Listed by:
Alexander Wensjoe 786-439-6154,
Randolph & Main Realty Group
Source: MIAMI,MLS#: A12119774 Originating MLS: A-Miami Association of REALTORS
Facts & features
Interior
Bedrooms & bathrooms
- Bedrooms: 3
- Bathrooms: 1
- Full bathrooms: 1
Rooms
- Room types: Family Room
Heating
- Central
Cooling
- Central Air
Appliances
- Included: Dryer, Microwave, Washer
Interior area
- Total structure area: 1,078
- Total interior livable area: 998 sqft
Video & virtual tour
Property
Parking
- Total spaces: 3
- Parking features: Driveway
- Carport spaces: 3
- Has uncovered spaces: Yes
Features
- Stories: 1
- Entry location: First Floor Entry
- Pool features: R30-No Pool/No Water
- Fencing: Fenced
- View description: None
Lot
- Size: 6,007 Square Feet
- Features: 1/4 To Less Than 1/2 Acre Lot
Details
- Parcel number: 494211050560
- Zoning: R-1B
Construction
Type & style
- Home type: SingleFamily
- Property subtype: Single Family Residence
Materials
- Concrete Block Construction
- Roof: Shingle
Condition
- Year built: 1960
Utilities & green energy
- Sewer: Public Sewer
- Water: Municipal Water
Community & HOA
Community
- Features: None, No Subdiv/Park Info
- Subdivision: Collier Estates 3rd Add
HOA
- Has HOA: No
Location
- Region: Fort Lauderdale
Financial & listing details
- Price per square foot: $466/sqft
- Tax assessed value: $310,200
- Annual tax amount: $6,000
- Date on market: 11/6/2026
- Listing terms: All Cash,Conventional,FHA
Estimated market value
Not available
Estimated sales range
Not available
Not available
Price history
| Date | Event | Price |
|---|---|---|
| 11/7/2026 | Listed for sale | $465,000+8.1%$466/sqft |
Source:  MIAMI #A12119774 Report a problem | ||
| 3/2/2026 | Listing removed | $430,000$431/sqft |
Source: MIAMI #A11896371 Report a problem | ||
| 2/4/2026 | Price change | $430,000-2.2%$431/sqft |
Source: MIAMI #A11896371 Report a problem | ||
| 1/16/2026 | Price change | $439,500-1.2%$440/sqft |
Source: MIAMI #A11896371 Report a problem | ||
| 12/25/2025 | Price change | $445,000-2.2%$446/sqft |
Source: MIAMI #A11896371 Report a problem | ||
| 10/15/2025 | Listed for sale | $455,000+37.9%$456/sqft |
Source: MIAMI #A11896371 Report a problem | ||
| 4/9/2024 | Sold | $330,000-5.7%$331/sqft |
Source:  BeachesMLS #F10418449 Report a problem | ||
| 3/3/2024 | Pending sale | $350,000$351/sqft |
Source: BeachesMLS #F10418449 Report a problem | ||
| 2/15/2024 | Listed for sale | $350,000+407.2%$351/sqft |
Source: BeachesMLS #F10418449 Report a problem | ||
| 6/3/1996 | Sold | $69,000$69/sqft |
Source: Public Record Report a problem | ||
Public tax history
| Year | Property taxes | Tax assessment |
|---|---|---|
| 2025 | $7,159 +276.9% | $310,200 +231.5% |
| 2024 | $1,900 +10.5% | $93,570 +3% |
| 2023 | $1,719 +8.2% | $90,850 +3% |
| 2022 | $1,589 +7% | $88,210 +3% |
| 2021 | $1,485 +7% | $85,650 +1.4% |
| 2020 | $1,388 +3.5% | $84,470 +2.3% |
| 2019 | $1,341 | $82,580 +1.9% |
| 2018 | $1,341 +4.7% | $81,050 +2.1% |
| 2017 | $1,280 +1.4% | $79,390 +2.1% |
| 2016 | $1,263 +1.7% | $77,760 +0.7% |
| 2015 | $1,242 -0.1% | $77,220 +0.8% |
| 2014 | $1,243 | $76,610 +1.5% |
| 2013 | $1,243 -3.2% | $75,480 -11.9% |
| 2012 | $1,284 +5.7% | $85,630 -9.9% |
| 2011 | $1,216 0% | $95,070 +30.8% |
| 2010 | $1,216 +6.9% | $72,670 +2.7% |
| 2009 | $1,137 -6.7% | $70,760 +0.1% |
| 2008 | $1,218 -13.8% | $70,690 +3% |
| 2007 | $1,414 +1.5% | $68,640 +2.5% |
| 2006 | $1,393 | $66,970 +3% |
| 2005 | -- | $65,020 |
Find assessor info on the county website
Monthly payment
Est. payment
Payment breakdown
Explore the cost of this home by adjusting the details. Changes won't be saved.Climate risks
Neighborhood: North Andrews Gardens
Similar homes
- $517,9953 bd2 ba1.3k sqftNorth Andrews Gardens Fir, Oakland Park, FL 33334For Sale

 MLS ID #A12110656, Timothy Krause, Compass Florida, LLC. MIAMI
- $490,0003 bd2 ba1.2k sqftNorth Andrews Terrace Fir, Oakland Park, FL 33309For Sale
 MLS ID #A12041596, Andrew Liebenhaut, Charles Rutenberg Realty FTL. MIAMI
- $470,0003 bd2 ba990 sqftBroadview Country Club Es, North Lauderdale, FL 33068For Sale
 MLS ID #A12085376, Kenneth Grant III, Grant and Associates Real Estate INC. MIAMI
- $494,0003 bd2 ba1.1k sqftPompano Beach Highlands 8, Pompano Beach, FL 33064For Sale
 MLS ID #A12111538, Hana Levy, United Realty Group Inc. MIAMI
- $468,8003 bd2 ba1.3k sqftMelrose Manor, Fort Lauderdale, FL 33312For SaleMLS ID #A12104122, Susan Scelfo, First Service Realty ERA. MIAMI
- $369,9002 bd2 ba1k sqftTamarac Lakes, Tamarac, FL 33309For SaleMLS ID #A12119346, Salesperson Non Member, Non-MLS Member. MIAMI
- $449,0004 bd3 ba1k sqftNorth Lauderdale Village, Pompano Beach, FL 33068For SaleMLS ID #A12088731, Sandra Piquant, Align Right Realty K1 Group. MIAMI
- $475,0003 bd1 ba906 sqftAnsonia Gardens, Fort Lauderdale, FL 33315For SaleMLS ID #A12082551, Michael Vera, Vera Signature Brokerage LLC. MIAMI
- $500,0002 bd2 ba1.2k sqftSunrise Golf Village Sec, Sunrise, FL 33313For SaleMLS ID #A12117816, Rafael Latorre, Lifestyle International Realty. MIAMI
- $399,9002 bd2 ba1.4k sqftParadise Gardens Sec 1, Margate, FL 33063For SaleMLS ID #A12104666, Lina Daza, Compass Florida, LLC. MIAMI
- $475,0002 bd2 ba1k sqftRiverside Estates Add Rev, Fort Lauderdale, FL 33312For SaleMLS ID #A12080328, Michael Vera, Vera Signature Brokerage LLC. MIAMI
- $435,9003 bd2 ba1.4k sqftDorsey Park 4th Add, Fort Lauderdale, FL 33311For SaleMLS ID #A12044027, LaToya London, Elite Realty Partners, Inc.. MIAMI
- $509,9993 bd2 ba1.2k sqftMidland 1st Add, Fort Lauderdale, FL 33312For SaleMLS ID #A12112792, Helen Orukotan, Element Real Estate Group. MIAMI
- $499,0004 bd2 ba1k sqftBrendale Heights, Fort Lauderdale, FL 33312For SaleMLS ID #A12045629, Carlos Rivero, RE/MAX Advance Realty II. MIAMI
- $525,0003 bd2 ba1.3k sqftLauderdale Park 6-33 1/2, Fort Lauderdale, FL 33305For SaleMLS ID #A12045171, Desiree Avila, Avila Real Estate LLC. MIAMI
- $570,0003 bd2 ba1.2k sqftPine Crest First Add, Pompano Beach, FL 33060For SaleMLS ID #A12109336, Cesar Villarreal, Keller Williams Capital Realty. MIAMI
- $430,0004 bd2 ba1.2k sqftLarkdale Unit 4, Fort Lauderdale, FL 33311For SaleMLS ID #A12083573, Carlos Prieto, Realty Hub. MIAMI
- $534,9003 bd1 ba1k sqftProgresso, Fort Lauderdale, FL 33311For SaleMLS ID #A12056574, Xenia Rojas, The Keyes Company. MIAMI
- $415,0003 bd2 ba1.1k sqftJohn F Kennedy Estates Se, Fort Lauderdale, FL 33311For SaleMLS ID #A12014067, Johnjon Gonzalez, Luxe Properties. MIAMI
- $555,0003 bd2 ba1k sqftProgresso, Fort Lauderdale, FL 33311For SaleMLS ID #A12094907, Abraham Elbaz, The Real Estate Lab, Inc.. MIAMI
