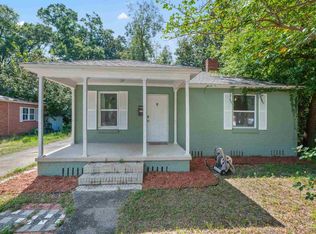
This is a 1157 square foot, 3.0 bathroom, single family home. This home is located at 641 W Jordan St, Pensacola, FL 32501.
Pre-foreclosure
Street View
Est. $116,300
641 W Jordan St, Pensacola, FL 32501
--beds
3baths
1,157sqft
SingleFamily
Built in 1946
8,999 Square Feet Lot
$116,300 Zestimate®
$101/sqft
$-- HOA
Overview
- 361 days
- 11
- 0
Facts & features
Interior
Bedrooms & bathrooms
- Bathrooms: 3
Heating
- Other
Cooling
- Central
Features
- Flooring: Hardwood
- Basement: Unfinished
Interior area
- Total interior livable area: 1,157 sqft
Property
Parking
- Parking features: Garage - Attached
Features
- Exterior features: Brick
Lot
- Size: 8,999 Square Feet
Details
- Parcel number: 182S303101005006
Construction
Type & style
- Home type: SingleFamily
Materials
- Wood
- Foundation: Wood
- Roof: Composition
Condition
- Year built: 1946
Community & HOA
Location
- Region: Pensacola
Financial & listing details
- Price per square foot: $101/sqft
- Tax assessed value: $106,768
- Annual tax amount: $1,652
Foreclosure details
Estimated market value
$116,300
$85,000 - $154,000
$1,944/mo
Price history
Price history is unavailable.
Public tax history
| Year | Property taxes | Tax assessment |
|---|---|---|
| 2025 | $1,652 +17% | $106,768 +2.1% |
| 2024 | $1,412 +4.3% | $104,603 +4.1% |
| 2023 | $1,353 +8.1% | $100,460 +10.5% |
| 2022 | $1,252 +10.9% | $90,930 +25.3% |
| 2021 | $1,129 +10.5% | $72,587 +10.3% |
| 2020 | $1,022 +3.7% | $65,812 +5.1% |
| 2019 | $986 | $62,625 +5.4% |
| 2018 | $986 +2.8% | $59,437 +4.2% |
| 2017 | $959 +1.7% | $57,016 -0.4% |
| 2016 | $942 -1.8% | $57,261 +4% |
| 2015 | $960 | $55,079 +5% |
| 2014 | $960 | $52,455 +6.9% |
| 2013 | -- | $49,049 -3.3% |
| 2012 | -- | $50,702 -3.3% |
| 2011 | -- | $52,425 +5.1% |
| 2010 | -- | $49,873 -3.3% |
| 2009 | -- | $51,595 -7.4% |
| 2008 | -- | $55,701 -5.5% |
| 2007 | -- | $58,920 -5% |
| 2006 | -- | $62,030 +38.7% |
| 2005 | -- | $44,720 +1.9% |
| 2004 | -- | $43,880 +1.9% |
| 2003 | -- | $43,060 +2.4% |
| 2002 | -- | $42,050 |
| 2001 | -- | $42,050 +5.9% |
| 2000 | -- | $39,700 +27.2% |
| 1999 | -- | $31,200 |
Find assessor info on the county website
Monthly payment
Climate risks
Neighborhood: Englewood
Similar homes
- $110,0003 bd1 ba782 sqft121 W Garfield Dr, Pensacola, FL 32505For Sale
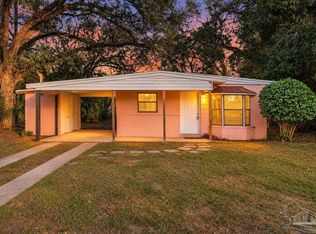 MLS ID #691201, Rheanna Parent, KELLER WILLIAMS REALTY GULF COAST. PAR
- $95,0003 bd1 ba942 sqft303 Yoakum Ct, Pensacola, FL 32505For Sale
 MLS ID #690235, Jess Townley, Century 21 BE3. PAR
- $114,9003 bd2 ba1.3k sqft3424 W Brainerd St, Pensacola, FL 32505For Sale
 MLS ID #689717, Steven Koleno, Beycome of Florida, LLC. PAR
- $120,0004 bd2 ba1.7k sqft4514 Havre Way, Pensacola, FL 32505For Sale
 MLS ID #689192, Guy Goldrat, Go 2 Guy Realty Inc.. PAR
- $105,0001 bd1 ba880 sqft3026 N Roosevelt St, Pensacola, FL 32503For Sale
 MLS ID #1012335, Joanna Johannes, Coconut Palm Real Estate. Navarre Area BOR
