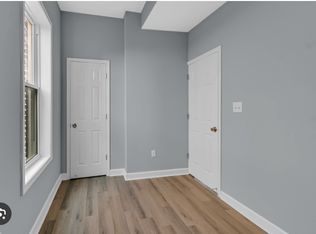
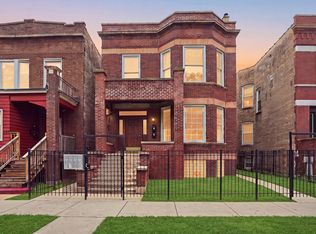
Turnkey investment or live-in opportunity in Chicago's West Woodlawn neighborhood. This fully renovated building features two 2-bed/1-bath units (garden and first floor) and one 3-bed/1-bath unit on the second floor. Each apartment offers modern finishes, updated kitchens, baths and bright, open living spaces. This property has an ideal setup for an owner-occupant looking for rental income, or an investor seeking a ready-to-go property with strong potential returns. Located near Washington Park, the future Obama Presidential Library, University of Chicago, the CTA Green Line, and major expressways, This property offers convenient access to the Lakefront, downtown, and Hyde Park. Don't miss your chance to own a fully rehabbed property in the heart of West Woodlawn!
Active
$650,000
6415 S Evans Ave, Chicago, IL 60637
7beds
--sqft
Multi Family
Built in 1898
-- sqft lot
$-- Zestimate®
$--/sqft
$-- HOA
What's special
Modern finishesUpdated kitchensBright open living spaces
- 16 days
- 82
- 12
Zillow last checked:
Listing updated:
Listed by:
Julia Myers (618)741-9175,
eXp Realty
Source: MRED as distributed by MLS GRID,MLS#: 12497447
Facts & features
Interior
Bedrooms & bathrooms
- Bedrooms: 7
- Bathrooms: 3
- Full bathrooms: 3
Heating
- Natural Gas, Forced Air
Features
- Basement: None
Property
Parking
- Total spaces: 2
- Parking features: Yes, Garage Owned, Detached, Garage
- Garage spaces: 2
Lot
- Size: 3,050 Square Feet
- Dimensions: 25 X 122
Details
- Parcel number: 20222150040000
- Zoning: MULTI
- Special conditions: None
Construction
Type & style
- Home type: MultiFamily
- Property subtype: Multi Family
Materials
- Brick
- Foundation: Concrete Perimeter
- Roof: Flat
Condition
- New construction: No
- Year built: 1898
- Major remodel year: 2025
Utilities & green energy
- Sewer: Public Sewer
- Water: Public
Community & HOA
Location
- Region: Chicago
Financial & listing details
- Tax assessed value: $128,300
- Annual tax amount: $1,588
- Date on market: 10/9/2026
- Ownership: Fee Simple
Estimated market value
Not available
Estimated sales range
Not available
$1,851/mo
Price history
| Date | Event | Price |
|---|---|---|
| 10/9/2026 | Listed for sale | $650,000 |
Source: MRED as distributed by MLS GRID #12497447 Report a problem | ||
| 8/11/2026 | Listing removed | $650,000 |
Source: eXp Realty #12497447 Report a problem | ||
| 4/24/2026 | Listed for sale | $650,000 |
Source: eXp Realty #12497447 Report a problem | ||
| 11/20/2025 | Contingent | $650,000 |
Source:  MRED as distributed by MLS GRID #12497447 Report a problem | ||
| 10/30/2025 | Listed for sale | $650,000 |
Source: MRED as distributed by MLS GRID #12497447 Report a problem | ||
| 10/28/2025 | Contingent | $650,000 |
Source: MRED as distributed by MLS GRID #12497447 Report a problem | ||
| 10/16/2025 | Listed for sale | $650,000+132.1% |
Source: MRED as distributed by MLS GRID #12497447 Report a problem | ||
| 1/16/2024 | Listing removed | -- |
Source: MRED as distributed by MLS GRID #11925607 Report a problem | ||
| 11/7/2023 | Listed for sale | $280,000+154.5% |
Source: MRED as distributed by MLS GRID #11925607 Report a problem | ||
| 12/21/2022 | Sold | $110,000-16.7% |
Source: MRED as distributed by MLS GRID #11046301 Report a problem | ||
| 12/9/2022 | Pending sale | $132,000 |
Source: MRED as distributed by MLS GRID #11046301 Report a problem | ||
| 12/7/2022 | Contingent | $132,000 |
Source: MRED as distributed by MLS GRID #11046301 Report a problem | ||
| 10/26/2022 | Listed for sale | $132,000 |
Source: MRED as distributed by MLS GRID #11046301 Report a problem | ||
| 8/3/2022 | Pending sale | $132,000 |
Source: MRED as distributed by MLS GRID #11046301 Report a problem | ||
| 7/29/2022 | Contingent | $132,000 |
Source: MRED as distributed by MLS GRID #11046301 Report a problem | ||
| 5/20/2022 | Listed for sale | $132,000 |
Source: MRED as distributed by MLS GRID #11046301 Report a problem | ||
| 4/8/2022 | Listing removed | $132,000 |
Source: MRED as distributed by MLS GRID #11046301 Report a problem | ||
| 2/13/2022 | Pending sale | $132,000 |
Source: MRED as distributed by MLS GRID #11046301 Report a problem | ||
| 1/28/2022 | Listing removed | -- |
Source: MRED as distributed by MLS GRID #11046301 Report a problem | ||
| 6/18/2021 | Pending sale | $132,000 |
Source: MRED as distributed by MLS GRID #11046301 Report a problem | ||
| 4/8/2021 | Listed for sale | $132,000+46.7% |
Source: MRED as distributed by MLS GRID #11046301 Report a problem | ||
| 10/25/2018 | Sold | $90,000-30.7% |
Source: MRED as distributed by MLS GRID #09760921 Report a problem | ||
| 9/7/2018 | Pending sale | $129,900 |
Source: Royal Service Realty Elite Properties & Estates Inc #09760921 Report a problem | ||
| 7/12/2018 | Price change | $129,900-18.8% |
Source: Royal Service Realty Elite Properties & Estates Inc #09760921 Report a problem | ||
| 5/9/2018 | Price change | $159,900-3% |
Source: Royal Service Realty Elite Properties & Estates Inc #09760921 Report a problem | ||
| 1/9/2018 | Listed for sale | $164,900 |
Source: Royal Service Realty Elite Properties & Estates Inc #09760921 Report a problem | ||
Public tax history
| Year | Property taxes | Tax assessment |
|---|---|---|
| 2024 | $2,586 +62.8% | $12,830 +71.1% |
| 2023 | $1,588 +2.9% | $7,500 |
| 2022 | $1,543 +2.3% | $7,500 |
| 2021 | $1,508 -57.6% | $7,500 -53% |
| 2020 | $3,555 -2.4% | $15,956 -12% |
| 2019 | $3,643 +1.7% | $18,132 |
| 2018 | $3,582 -11.3% | $18,132 -3.3% |
| 2017 | $4,038 +7.5% | $18,757 |
| 2016 | $3,757 +9.3% | $18,757 |
| 2015 | $3,437 +11.9% | $18,757 +13.3% |
| 2014 | $3,071 +2% | $16,551 |
| 2013 | $3,010 +1.4% | $16,551 |
| 2012 | $2,970 -11.9% | $16,551 -20.4% |
| 2011 | $3,370 -0.4% | $20,794 |
| 2010 | $3,384 +4.4% | $20,794 |
| 2009 | $3,243 -5% | $20,794 -12.6% |
| 2008 | $3,412 +1% | $23,782 |
| 2007 | $3,378 -1.1% | $23,782 |
| 2006 | $3,414 +63% | $23,782 +85.5% |
| 2005 | $2,095 +1% | $12,822 |
| 2004 | $2,074 +2.2% | $12,822 |
| 2003 | $2,029 +46.5% | $12,822 +66.3% |
| 2002 | $1,385 +3.8% | $7,709 |
| 2001 | $1,335 +14.9% | $7,709 |
| 2000 | $1,162 -0.7% | $7,709 +27.4% |
| 1999 | $1,170 | $6,049 |
Find assessor info on the county website
Monthly payment
Est. payment
Payment breakdown
Explore the cost of this home by adjusting the details. Changes won't be saved.Climate risks
Neighborhood: West Woodlawn
Nearby schools

Similar homes
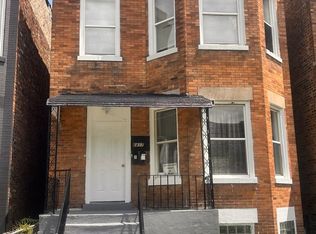
- $474,9995 bd2 ba-- sqft6317 S Eberhart Ave, Chicago, IL 60637New
 MLS ID #12792690, Micah White, Compass. MRED as distributed by MLS GRID
- $524,90010 bd5 ba3.7k sqft6438 S Saint Lawrence Ave, Chicago, IL 60637Active
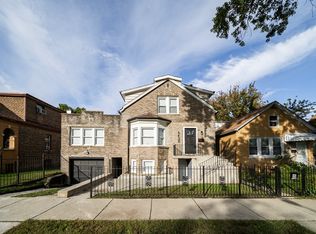 MLS ID #12775961, Jonathan Gil, Equity Realty. MRED as distributed by MLS GRID
- $410,0007 bd3 ba-- sqft6802 S Champlain Ave, Chicago, IL 60637Active
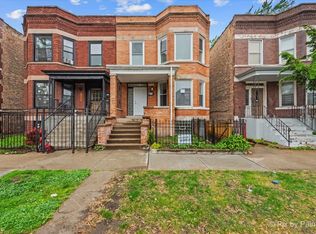 MLS ID #12770143, Vincent A Incopero, Nexus Chicago Realty Group, LL. MRED as distributed by MLS GRID
- $624,90010 bd4 ba-- sqft7141 S King Dr, Chicago, IL 60619Active
 MLS ID #12760442, Jorge Vega, New Avenue Realty LLC. MRED as distributed by MLS GRID
