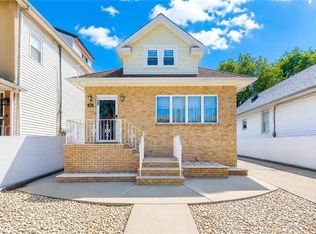
Beautiful cozy fully renovated semi-detached single-family property located in Port Richmond. 23 x 22 building sits on 30 x 50 lot. Property tax $3,826. Full finished basement with separated entrance features an extra space with a full bathroom. First floor features a bright living room, spacious eat-in kitchen with dining area. Second floor offers two generously sized bedrooms, and a full bathroom. Fenced backyard adds valuable outdoor space with privacy. Closed to park and shopping mall. Ready to move in home in excellent condition.
Pending
$615,000
65 Floyd St, Staten Island, NY 10310
2beds
1,173sqft
Single Family Residence
Built in 1930
1,500 Square Feet Lot
$610,000 Zestimate®
$524/sqft
$-- HOA
What's special
Two generously sized bedrooms
- 54 days |
- 98 |
- 0 |
Zillow last checked:
Listing updated:
Listed by:
ProBase Real Estate 718-210-2727,
Juan (Angela) Liu 315-704-9478
Source: BNYMLS,MLS#: 501362
Facts & features
Interior
Bedrooms & bathrooms
- Bedrooms: 2
- Bathrooms: 2
- Full bathrooms: 2
Heating
- Natural Gas, Baseboard
Cooling
- A/C Unit
Appliances
- Included: Tankless Water Heater
Features
- Flooring: Carpet, Hardwood, Laminate
- Basement: Finished,Full
Interior area
- Total structure area: 1,173
- Total interior livable area: 1,173 sqft
Property
Parking
- Parking features: Street, None
- Has uncovered spaces: Yes
Features
- Stories: 2
- Fencing: Full
Lot
- Size: 1,500 Square Feet
- Dimensions: 30x50
- Features: Back Yard
Details
- Foundation area: 506
- Parcel number: 002270177
- Zoning: R3A
- Special conditions: Arm's Length
Construction
Type & style
- Home type: SingleFamily
- Architectural style: Other
- Property subtype: Single Family Residence
- Attached to another structure: Yes
Materials
- Siding
- Foundation: Concrete Perimeter
- Roof: Other
Condition
- Year built: 1930
Utilities & green energy
- Electric: 110 V
Community & HOA
Community
- Subdivision: Staten Island
Location
- Region: Staten Island
Financial & listing details
- Price per square foot: $524/sqft
- Tax assessed value: $451,000
- Annual tax amount: $3,826
- Date on market: 5/12/2026
- Cumulative days on market: 54 days
Estimated market value
$610,000
$580,000 - $641,000
$3,274/mo
Price history
| Date | Event | Price |
|---|---|---|
| 6/3/2026 | Pending sale | $615,000$524/sqft |
Source: | ||
| 5/12/2026 | Listed for sale | $615,000$524/sqft |
Source: | ||
| 5/4/2026 | Listing removed | $615,000$524/sqft |
Source: | ||
| 2/10/2026 | Price change | $615,000-5.4%$524/sqft |
Source: | ||
| 12/8/2025 | Listed for sale | $650,000-10.3%$554/sqft |
Source: | ||
| 11/24/2025 | Listing removed | -- |
Source: Owner Report a problem | ||
| 11/7/2025 | Listed for sale | $725,000+27.4%$618/sqft |
Source: Owner Report a problem | ||
| 5/1/2023 | Listing removed | -- |
Source: | ||
| 12/27/2022 | Price change | $569,000-2.7%$485/sqft |
Source: | ||
| 12/13/2022 | Price change | $584,900-2.4%$499/sqft |
Source: | ||
| 11/26/2022 | Price change | $599,000-4.2%$511/sqft |
Source: | ||
| 11/21/2022 | Listed for sale | $625,000+25.3%$533/sqft |
Source: Owner Report a problem | ||
| 6/17/2022 | Listing removed | -- |
Source: | ||
| 4/15/2022 | Price change | $499,000-5.5%$425/sqft |
Source: | ||
| 4/4/2022 | Listed for sale | $528,000$450/sqft |
Source: | ||
| 4/1/2022 | Listing removed | -- |
Source: Owner Report a problem | ||
| 3/31/2022 | Price change | $528,000+55.3%$450/sqft |
Source: Owner Report a problem | ||
| 11/6/2015 | Listed for sale | $340,000+14.3%$290/sqft |
Source: Owner Report a problem | ||
| 9/27/2007 | Sold | $297,500+211.5%$254/sqft |
Source: Public Record Report a problem | ||
| 9/18/1995 | Sold | $95,500$81/sqft |
Source: Public Record Report a problem | ||
Public tax history
| Year | Property taxes | Tax assessment |
|---|---|---|
| 2025 | $3,826 +6% | $27,060 -6.2% |
| 2024 | $3,609 | $28,860 -7.7% |
| 2023 | -- | $31,260 +16.6% |
| 2022 | -- | $26,820 +20.8% |
| 2021 | -- | $22,200 -4.4% |
| 2020 | $3,360 +6% | $23,220 +0.5% |
| 2019 | $3,170 | $23,100 +54.2% |
| 2018 | -- | $14,976 +5.5% |
| 2017 | $2,893 +8.1% | $14,194 +6% |
| 2016 | $2,677 | $13,392 +1.2% |
| 2015 | $2,677 +11.8% | $13,228 +6% |
| 2014 | $2,395 | $12,480 -0.5% |
| 2013 | -- | $12,538 +6% |
| 2012 | -- | $11,829 +6% |
| 2011 | -- | $11,160 -16% |
| 2010 | -- | $13,281 +3.9% |
| 2009 | -- | $12,787 +3.7% |
| 2008 | -- | $12,326 |
| 2007 | -- | $12,326 +5.1% |
| 2006 | -- | $11,732 +6% |
| 2005 | -- | $11,068 +3.9% |
| 2004 | -- | $10,656 +3.7% |
| 2003 | -- | $10,272 |
| 2002 | -- | $10,272 +5.1% |
| 2001 | -- | $9,777 +6% |
| 2000 | -- | $9,224 |
Find assessor info on the county website
Monthly payment
Estimated monthly payment$1,822
All calculations are estimates and provided by Zillow, Inc. for informational purposes only. Actual amounts may vary.
HOA fees may include property taxes on listings classified as Co-Ops. Contact the listing agent and/or owner for fee details.
Mortgage interest rates are dependent on a number of factors, including credit score, down payment, and repayment length. Interest rate data provided by Zillow Group Marketplace, Inc. as of 1/1/1970 from various mortgage lenders with which we have lead or other similar arrangements; the Estimated Payment is an average of those rates.
See how much you could borrow to make a competitive offer.
Climate risks
Neighborhood: West Brighton
Nearby schools
GreatSchools rating
- 6/10Ps 45 John TylerGrades: PK-5Distance: 0.6 mi
- 6/10Is 27 Anning S PrallGrades: 6-8Distance: 0.3 mi
- 5/10Susan E Wagner High SchoolGrades: 9-12Distance: 2.5 mi


A local agent can set up tours, give advice and negotiate with sellers.


Nearby cities
Nearby neighborhoods
Nearby zip codes
Other New York Topics
