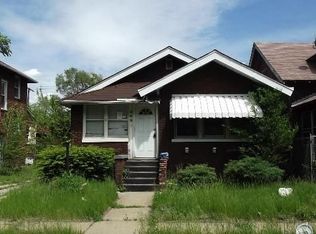
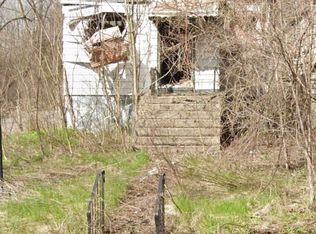
FIXER UPPER!
Active
Price cut: $1K (10/15)
$4,000
659 Vermont St, Gary, IN 46402
3beds
1,196sqft
Single Family Residence
Built in 1923
5,227 Square Feet Lot
$-- Zestimate®
$3/sqft
$-- HOA
What's special
- 44 days
- 1,113
- 49
Zillow last checked:
Listing updated:
Listed by:
Eudith Vacio,
eXp Realty, LLC 888-611-3912
Source: NIRA as distributed by MLS GRID,MLS#: 846428
Facts & features
Interior
Bedrooms & bathrooms
- Bedrooms: 3
- Bathrooms: 1
- Full bathrooms: 1
Rooms
- Room types: Bedroom 2, Primary Bedroom, Living Room, Kitchen, Dining Room, Bedroom 3
Primary bedroom
- Level: Upper
- Area: 110
- Dimensions: 11.0 x 10.0
Bedroom 2
- Level: Main
- Area: 110
- Dimensions: 11.0 x 10.0
Bedroom 3
- Level: Upper
- Area: 110
- Dimensions: 11.0 x 10.0
Dining room
- Level: Main
- Area: 130
- Dimensions: 13.0 x 10.0
Kitchen
- Level: Main
- Area: 90
- Dimensions: 10.0 x 9.0
Living room
- Level: Main
- Area: 220
- Dimensions: 20.0 x 11.0
Heating
- None
Appliances
- Included: None
Features
- None
- Basement: Interior Entry
- Has fireplace: No
Interior area
- Total structure area: 1,196
- Total interior livable area: 1,196 sqft
- Finished area above ground: 1,196
Property
Features
- Levels: Two
- View description: None
Lot
- Size: 5,227 Square Feet
- Features: Paved
Details
- Parcel number: 450803407012000004
- Special conditions: None
Construction
Type & style
- Home type: SingleFamily
- Property subtype: Single Family Residence
Condition
- New construction: No
- Year built: 1923
Utilities & green energy
- Sewer: Other
- Water: Public
Community & HOA
Community
- Subdivision: Gary Land Companys 01
HOA
- Has HOA: No
Location
- Region: Gary
Financial & listing details
- Price per square foot: $3/sqft
- Tax assessed value: $11,000
- Annual tax amount: $276
- Date on market: 10/6/2026
- Listing agreement: Exclusive Right To Sell
- Listing terms: Cash
Estimated market value
Not available
Estimated sales range
Not available
$1,412/mo
Price history
| Date | Event | Price |
|---|---|---|
| 10/15/2026 | Price change | $4,000-20%$3/sqft |
Source:  NIRA as distributed by MLS GRID #846428 Report a problem | ||
| 10/6/2026 | Listed for sale | $5,000-44.4%$4/sqft |
Source: NIRA as distributed by MLS GRID #846428 Report a problem | ||
| 7/31/2023 | Sold | $9,000-40%$8/sqft |
Source: NIRA as distributed by MLS GRID #524411 Report a problem | ||
| 7/4/2023 | Contingent | $15,000$13/sqft |
Source: NIRA as distributed by MLS GRID #524411 Report a problem | ||
| 1/25/2023 | Listed for sale | $15,000+2900%$13/sqft |
Source: NIRA as distributed by MLS GRID #524411 Report a problem | ||
| 6/26/2020 | Sold | $500 |
Source: Public Record Report a problem | ||
Public tax history
| Year | Property taxes | Tax assessment |
|---|---|---|
| 2025 | $276 +8.3% | $11,600 +5.5% |
| 2024 | $255 +4.6% | $11,000 +8.9% |
| 2023 | $243 +4.4% | $10,100 +6.3% |
| 2022 | $233 +2.2% | $9,500 +4.4% |
| 2021 | $228 +28.1% | $9,100 +2.2% |
| 2020 | $178 -95.2% | $8,900 |
| 2019 | $3,740 +21.6% | $8,900 -5.3% |
| 2018 | $3,076 +1251% | $9,400 -1.1% |
| 2017 | $228 | $9,500 -2.1% |
| 2016 | $228 -62.5% | $9,700 -82.9% |
| 2014 | $607 -0.8% | $56,700 -2.6% |
| 2013 | $612 -1.1% | $58,200 +0.3% |
| 2012 | $619 +17.3% | $58,000 +18.6% |
| 2011 | $528 -2.9% | $48,900 +2.3% |
| 2010 | $543 | $47,800 -7% |
| 2009 | -- | $51,400 +31.5% |
| 2007 | -- | $39,100 +97.5% |
| 2006 | -- | $19,800 |
| 2005 | -- | $19,800 |
| 2004 | -- | $19,800 +147.5% |
| 2003 | -- | $8,000 |
| 2002 | -- | $8,000 +199.6% |
| 2001 | -- | $2,670 |
Find assessor info on the county website
Monthly payment
Est. payment