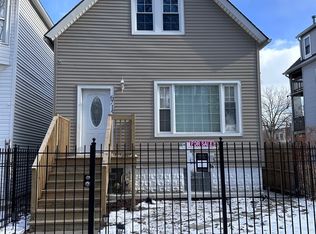
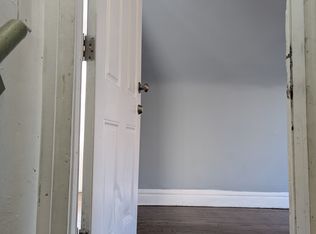
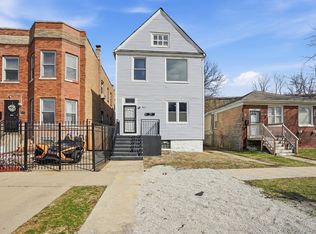
Excellent investment opportunity! Property qualifies for the $15,000 grant funded by the Chicago Neighborhood Recovery Program (CNRP). This fully occupied multi-unit property featuring 2-bedroom units with kitchen, bathroom, in-unit washer/dryer, and a full unfinished basement. Perfect for investors looking to generate immediate cash flow or owner-occupants looking to live in one unit and rent the other. Recent updates include a complete roof tear-off with new plywood in 2024, remodeled bathrooms in 2023, updated electrical, copper plumbing, newer hot water tanks, and newer concrete around the property. Rear parking for up to 4 cars. Fenced yard will be completed prior to closing. Property sold as-is.
Active
Price cut: $10K (6/10)
$245,000
6713 S Sangamon St, Chicago, IL 60621
4beds
--sqft
Multi Family
Built in 1895
-- sqft lot
$243,700 Zestimate®
$--/sqft
$-- HOA
What's special
Copper plumbingNewer hot water tanksFull unfinished basementUpdated electrical
- 49 days |
- 347 |
- 28 |
Zillow last checked:
Listing updated:
Listed by:
Jacquelyn Pantoja 773-888-1220,
Cloud Gate Realty LLC
Source: MRED as distributed by MLS GRID,MLS#: 12635524
Loading...
Facts & features
Interior
Bedrooms & bathrooms
- Bedrooms: 4
- Bathrooms: 2
- Full bathrooms: 2
Heating
- Natural Gas
Features
- Basement: Unfinished,Full
Property
Parking
- Total spaces: 3
- Parking features: Yes
Lot
- Size: 3,125 Square Feet
- Dimensions: 25X125
Details
- Parcel number: 20204050050000
- Special conditions: None
Construction
Type & style
- Home type: MultiFamily
- Property subtype: Multi Family
Materials
- Vinyl Siding
- Roof: Asphalt
Condition
- New construction: No
- Year built: 1895
- Major remodel year: 2023
Utilities & green energy
- Sewer: Public Sewer
- Water: Public
Community & HOA
Location
- Region: Chicago
Financial & listing details
- Tax assessed value: $82,010
- Annual tax amount: $1,647
- Date on market: 5/7/2026
- Ownership: Fee Simple
Estimated market value
$243,700
$232,000 - $256,000
$1,489/mo
Price history
| Date | Event | Price |
|---|---|---|
| 6/10/2026 | Price change | $245,000-3.9% |
Source: | ||
| 5/7/2026 | Listed for sale | $255,000+30.8% |
Source: | ||
| 4/22/2024 | Sold | $195,000+8.3% |
Source: | ||
| 3/12/2024 | Pending sale | $180,000 |
Source: | ||
| 3/7/2024 | Listed for sale | $180,000+340.1% |
Source: | ||
| 10/21/2022 | Sold | $40,900 |
Source: | ||
| 10/13/2022 | Contingent | $40,900 |
Source: | ||
| 10/6/2022 | Price change | $40,900-8.9% |
Source: | ||
| 9/30/2022 | Listed for sale | $44,900-25.2% |
Source: | ||
| 6/1/2019 | Listing removed | $60,000 |
Source: Re/Max Cityview #10310295 Report a problem | ||
| 3/16/2019 | Listed for sale | $60,000-29.4% |
Source: Re/Max Cityview #10310295 Report a problem | ||
| 1/19/2019 | Listing removed | $85,000 |
Source: Jean Pierre Realty Intl #10146288 Report a problem | ||
| 11/29/2018 | Listed for sale | $85,000+18.1% |
Source: Jean Pierre Realty Intl #10146288 Report a problem | ||
| 8/13/2018 | Listing removed | $72,000 |
Source: Corona Realty Group Inc. #09862635 Report a problem | ||
| 6/11/2018 | Price change | $72,000-10% |
Source: Corona Realty Group Inc. #09862635 Report a problem | ||
| 4/18/2018 | Price change | $80,000-5.9% |
Source: Corona Realty Group Inc. #09862635 Report a problem | ||
| 3/27/2018 | Price change | $85,000-8.5% |
Source: Corona Realty Group Inc. #09862635 Report a problem | ||
| 3/5/2018 | Price change | $92,900-7% |
Source: Corona Realty Group Inc. #09862635 Report a problem | ||
| 2/27/2018 | Listed for sale | $99,900-13.1% |
Source: Corona Realty Group Inc. #09862635 Report a problem | ||
| 2/24/2006 | Sold | $115,000 |
Source: Public Record Report a problem | ||
Public tax history
| Year | Property taxes | Tax assessment |
|---|---|---|
| 2024 | -- | $8,201 +126.5% |
| 2023 | $764 +2.6% | $3,620 |
| 2022 | $745 +2.3% | $3,620 |
| 2021 | $728 -37.3% | $3,620 -30.6% |
| 2020 | $1,162 -2.4% | $5,214 -12% |
| 2019 | $1,191 +1.7% | $5,926 |
| 2018 | $1,171 -65.6% | $5,926 -62.5% |
| 2017 | $3,401 +7.5% | $15,797 |
| 2016 | $3,164 +9.3% | $15,797 |
| 2015 | $2,895 +40.2% | $15,797 +41.9% |
| 2014 | $2,065 +2% | $11,132 |
| 2013 | $2,025 +1.4% | $11,132 |
| 2012 | $1,998 -7.6% | $11,132 -16.6% |
| 2011 | $2,163 -0.4% | $13,348 |
| 2010 | $2,172 +4.4% | $13,348 |
| 2009 | $2,081 -13.3% | $13,348 -20.3% |
| 2008 | $2,401 +1% | $16,738 |
| 2007 | $2,377 -1.1% | $16,738 |
| 2006 | $2,403 +121.7% | $16,738 +152.3% |
| 2005 | $1,084 +1% | $6,633 |
| 2004 | $1,073 +2.2% | $6,633 |
| 2003 | $1,050 +35.8% | $6,633 +54.2% |
| 2002 | $773 +3.8% | $4,302 |
| 2001 | $745 +36.3% | $4,302 |
| 2000 | $547 | $4,302 +51.2% |
| 1999 | $547 | $2,845 |
Find assessor info on the county website
Monthly payment
Est. payment$--/mo
Payment breakdown
Explore the cost of this home by adjusting the details. Changes won't be saved.All calculations are estimates and provided by Zillow, Inc. for informational purposes only. Actual amounts may vary.
HOA fees may include property taxes on listings classified as Co-Ops. Contact the listing agent and/or owner for fee details.
Mortgage interest rates are dependent on a number of factors, including credit score, down payment, and repayment length. Interest rate data provided by Zillow Group Marketplace, Inc. as of 1/1/1970 from various mortgage lenders with which we have lead or other similar arrangements; the Estimated Payment is an average of those rates.
See how much you could borrow to make a competitive offer.
Climate risks
Neighborhood: Englewood
Nearby schools
GreatSchools rating
- 3/10Wentworth Elementary SchoolGrades: PK-8Distance: 0.7 mi
- NAEXCEL ACADEMY - ENGLEWOOD HSGrades: 9-12Distance: 0.6 mi
Schools provided by the listing agent
- District: 299
Source: MRED as distributed by MLS GRID. This data may not be complete. We recommend contacting the local school district to confirm school assignments for this home.

A local agent can set up tours, give advice and negotiate with sellers.


- Illinois
- Cook County
- Chicago
- 60621
- Englewood
- 6713 S Sangamon St
Nearby cities
Nearby neighborhoods
Nearby zip codes
Other Chicago Topics
