$460,000
3 bd|2 ba|1.3k sqft
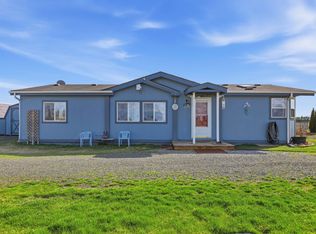
14211 W Mirage Ln, Spokane, WA 99224
For Sale
Likely to sell faster than
Zillow last checked:
Listing updated:
Nicole Page Main:208-627-9768,
Keller Williams Spokane - Main
Not available
Estimated sales range
Not available
Not available
| Date | Event | Price |
|---|---|---|
| 5/12/2026 | Pending sale | $599,900$363/sqft |
Source: | ||
| 5/8/2026 | Listed for sale | $599,900$363/sqft |
Source: | ||
| 5/8/2026 | Listing removed | $599,900$363/sqft |
Source: | ||
| 4/22/2026 | Listed for sale | $599,900-19.5%$363/sqft |
Source: | ||
| 9/2/2024 | Listing removed | $745,000$450/sqft |
Source: | ||
| 9/1/2024 | Pending sale | $745,000$450/sqft |
Source: | ||
| 7/31/2024 | Listed for sale | $745,000-2%$450/sqft |
Source: | ||
| 7/31/2024 | Listing removed | -- |
Source: | ||
| 5/30/2024 | Listed for sale | $760,000$459/sqft |
Source: | ||
| 5/30/2024 | Listing removed | -- |
Source: | ||
| 5/9/2024 | Listed for sale | $760,000-4.4%$459/sqft |
Source: | ||
| 10/15/2023 | Listing removed | -- |
Source: | ||
| 9/2/2023 | Price change | $795,000-3.6%$481/sqft |
Source: | ||
| 7/8/2023 | Listed for sale | $825,000+175%$499/sqft |
Source: | ||
| 10/14/2021 | Sold | $300,000-23.1%$181/sqft |
Source: Public Record Report a problem | ||
| 2/28/2019 | Sold | $390,000$236/sqft |
Source: Public Record Report a problem | ||
| 9/4/2018 | Sold | $390,000-2.3%$236/sqft |
Source: | ||
| 8/8/2018 | Pending sale | $399,000$241/sqft |
Source: RE/MAX OF SPOKANE #201820464 Report a problem | ||
| 7/27/2018 | Price change | $399,000-6.1%$241/sqft |
Source: RE/MAX of Spokane #201820464 Report a problem | ||
| 7/6/2018 | Listed for sale | $425,000+60.4%$257/sqft |
Source: RE/MAX of Spokane #201820464 Report a problem | ||
| 6/6/2011 | Sold | $265,000-8.6%$160/sqft |
Source: | ||
| 4/7/2011 | Listed for sale | $289,900+3.6%$175/sqft |
Source: FlatListingFee.com, Inc. DBA Flat List RE #201114505 Report a problem | ||
| 7/2/2008 | Sold | $279,900$169/sqft |
Source: | ||
| Year | Property taxes | Tax assessment |
|---|---|---|
| 2024 | $5,181 +6.6% | $517,400 +5.3% |
| 2023 | $4,860 +14.3% | $491,500 +9% |
| 2022 | $4,253 +0.9% | $451,000 +20.3% |
| 2021 | $4,213 -2.6% | $374,900 +6.1% |
| 2020 | $4,326 +14.6% | $353,500 +10.8% |
| 2019 | $3,776 | $319,000 +7% |
| 2018 | $3,776 -8.6% | $298,100 +15% |
| 2017 | $4,131 +17.9% | $259,300 +5.5% |
| 2016 | $3,504 +6% | $245,700 +4.1% |
| 2015 | $3,306 | $236,100 +2.3% |
| 2014 | $3,306 | $230,900 |
| 2013 | $3,306 +7.8% | -- |
| 2011 | $3,067 +6.3% | -- |
| 2010 | $2,884 | -- |
| 2009 | $2,884 | -- |
| 2008 | -- | -- |
| 2007 | $1,749 | $158,370 |
| 2001 | -- | -- |
| 1999 | $922 | $59,400 |
Find assessor info on the county website
Source: SMLS as distributed by MLS GRID. This data may not be complete. We recommend contacting the local school district to confirm school assignments for this home.
A local agent can set up tours, give advice and negotiate with sellers.