MLS# 274794 Home on WSU campus, currently being rented out to students each semester. This property is a great investment opportunity for those with children going to WSU or just looking to widen their financial sphere! The home features 4 bedrooms (two bonus rooms in the unfinished basement) and 2 bathrooms. Inside the main level of the home features laminate floors, an office space and a large spacious living room with a wood burning built in fireplace. Outside features a covered porch and off street parking around the side of the home. The home currently rents for $2800 a month including water/sewer/garbage.
Pending
$250,000
675 NE Maple St, Pullman, WA 99163
5beds
1,592sqft
Single Family Residence
Built in 1923
4,791 Square Feet Lot
$-- Zestimate®
$157/sqft
$-- HOA
What's special
- 12 days
- 17
- 0
Zillow last checked:
Listing updated:
Listed by:
Katlyn Cloninger 509-592-5699,
Beasley Realty
Source: PACMLS as distributed by MLS GRID,MLS#: 274794
Facts & features
Interior
Bedrooms & bathrooms
- Bedrooms: 5
- Bathrooms: 2
- Full bathrooms: 1
- 3/4 bathrooms: 1
Rooms
- Room types: Room - Bonus, Foyer
Appliances
- Included: Dryer, Range/Oven, Washer, Water Heater
Features
- Flooring: Laminate
- Basement: Unfinished,Windows - Egress,Windows - Non Egress
Interior area
- Total structure area: 3,184
- Total interior livable area: 1,592 sqft
Property
Parking
- Parking features: Off Street
Features
- Levels: 1 Story w/Basement
- Stories: 1
Lot
- Size: 4,791 Square Feet
Details
- Parcel number: 112350007060002
- Zoning: Residential
Construction
Type & style
- Home type: SingleFamily
- Property subtype: Single Family Residence
Condition
- New construction: No
- Year built: 1923
Utilities & green energy
- Sewer: Sewer Connected
- Water: Public
- Utilities for property: Appliances-Electric, Electricity Connected, Natural Gas Connected
Community & HOA
Location
- Region: Pullman
Financial & listing details
- Price per square foot: $157/sqft
- Tax assessed value: $248,457
- Annual tax amount: $3,394
- Date on market: 10/8/2026
- Cumulative days on market: 434 days
Estimated market value
Not available
Estimated sales range
Not available
$2,444/mo
Price history
| Date | Event | Price |
|---|---|---|
| 10/8/2026 | Pending sale | $250,000$157/sqft |
Source:  PACMLS as distributed by MLS GRID #274794 Report a problem | ||
| 9/1/2026 | Listing removed | $250,000$157/sqft |
Source: PACMLS as distributed by MLS GRID #292020 Report a problem | ||
| 8/12/2026 | Price change | $250,000-24%$157/sqft |
Source: PACMLS as distributed by MLS GRID #292020 Report a problem | ||
| 7/30/2026 | Price change | $2,000-13%$1/sqft |
Source: Zillow Rentals Report a problem | ||
| 7/4/2026 | Listed for rent | $2,300$1/sqft |
Source: Zillow Rentals Report a problem | ||
| 6/21/2026 | Listing removed | $2,300$1/sqft |
Source: Zillow Rentals Report a problem | ||
| 5/9/2026 | Price change | $329,000-10.8%$207/sqft |
Source: PACMLS as distributed by MLS GRID #292020 Report a problem | ||
| 4/24/2026 | Price change | $369,000-7.5%$232/sqft |
Source: PACMLS as distributed by MLS GRID #292020 Report a problem | ||
| 4/19/2026 | Listed for rent | $2,300$1/sqft |
Source: Zillow Rentals Report a problem | ||
| 4/11/2026 | Listed for sale | $399,000+5.3%$251/sqft |
Source: PACMLS as distributed by MLS GRID #292020 Report a problem | ||
| 4/7/2026 | Listing removed | $2,300$1/sqft |
Source: Zillow Rentals Report a problem | ||
| 3/13/2026 | Listed for rent | $2,300-11.5%$1/sqft |
Source: Zillow Rentals Report a problem | ||
| 3/3/2026 | Listing removed | $2,600$2/sqft |
Source: Zillow Rentals Report a problem | ||
| 12/23/2025 | Listed for rent | $2,600+23.8%$2/sqft |
Source: Zillow Rentals Report a problem | ||
| 10/13/2025 | Listing removed | $2,100$1/sqft |
Source: Zillow Rentals Report a problem | ||
| 8/12/2025 | Listed for rent | $2,100$1/sqft |
Source: Zillow Rentals Report a problem | ||
| 6/1/2025 | Listing removed | $379,000$238/sqft |
Source: PACMLS as distributed by MLS GRID #274794 Report a problem | ||
| 4/22/2025 | Price change | $379,000-5.2%$238/sqft |
Source: PACMLS as distributed by MLS GRID #274794 Report a problem | ||
| 10/31/2024 | Price change | $399,900-9.1%$251/sqft |
Source: PACMLS as distributed by MLS GRID #274794 Report a problem | ||
| 7/3/2024 | Price change | $440,000-2.2%$276/sqft |
Source: PACMLS as distributed by MLS GRID #274794 Report a problem | ||
| 3/31/2024 | Listed for sale | $450,000$283/sqft |
Source: PACMLS as distributed by MLS GRID #274794 Report a problem | ||
Public tax history
| Year | Property taxes | Tax assessment |
|---|---|---|
| 2025 | $2,890 -5.2% | $248,457 |
| 2024 | $3,048 -10.2% | $248,457 +2.4% |
| 2023 | $3,395 -5.7% | $242,650 |
| 2022 | $3,600 +0.1% | $242,650 |
| 2021 | $3,598 -2.1% | $242,650 +2.9% |
| 2019 | $3,673 +1.7% | $235,872 |
| 2018 | $3,612 +5.6% | $235,872 |
| 2017 | $3,419 -4.9% | $235,872 |
| 2016 | $3,594 +153.3% | $235,872 +157% |
| 2015 | $1,419 -1% | $91,776 +8.8% |
| 2014 | $1,433 +23.3% | $84,336 |
| 2013 | $1,162 | $84,336 |
| 2011 | -- | $84,336 |
| 2010 | -- | $84,336 |
Find assessor info on the county website
Monthly payment
Est. payment
Payment breakdown
Explore the cost of this home by adjusting the details. Changes won't be saved.Climate risks
Neighborhood: 99163


Similar homes
- $290,0004 bd2 ba2.3k sqft960 NE Maple St, Pullman, WA 99163For Sale
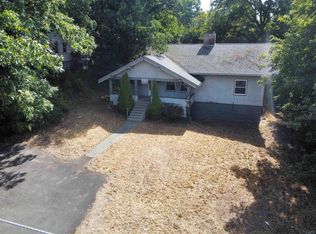
 MLS ID #296124, Joe Pitzer, RE/MAX Home and Land. PACMLS as distributed by MLS GRID
- $369,9004 bd2 ba1.3k sqft1020 NW Charlotte St, Pullman, WA 99163For Sale
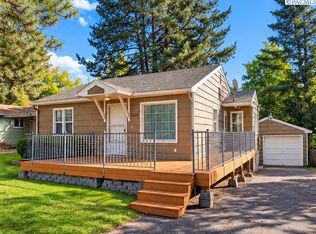 MLS ID #297180, Patti Green-Kent, Coldwell Banker Tomlinson Associates. PACMLS as distributed by MLS GRID
- $289,0004 bd2 ba2.3k sqft321 NW Cleveland St, Pullman, WA 99163For Sale
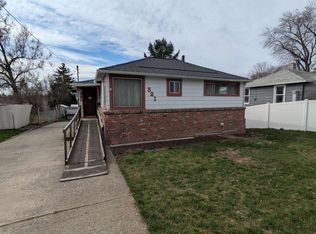 MLS ID #291748, Sage McCetich, Green Grass Real Estate, LLC. PACMLS as distributed by MLS GRID
- $259,9002 bd1 ba1k sqft225 SE Spring St, Pullman, WA 99163For Sale
 MLS ID #295474, Darcell Myers, Woodbridge Real Estate. PACMLS as distributed by MLS GRID
- $299,9004 bd2 ba2.3k sqft468-470 NE Maiden Ln, Pullman, WA 99163For SaleMLS ID #295010, Helene Hopkins, Helenes Property Place LLC. PACMLS as distributed by MLS GRID
- $289,0003 bd2 ba1.3k sqft560 SE Taylor St, Pullman, WA 99163For SaleMLS ID #295886, Justin Cofer, Beasley Realty. PACMLS as distributed by MLS GRID
- $349,0004 bd3 ba1.7k sqft1320 NE McGee St, Pullman, WA 99163For SaleMLS ID #294389, Jacob Davis, Woodbridge Real Estate. PACMLS as distributed by MLS GRID
- $220,0004 bd2 ba1.6k sqft600 SW Crestview St APT 15, Pullman, WA 99163For SaleMLS ID #295612, Krista S Gross, Realogics Sotheby's Int'l Rlty. PACMLS as distributed by MLS GRID
- $299,0003 bd2 ba2k sqft230 SE Pine St, Pullman, WA 99163For SaleMLS ID #295057, Helene Hopkins, Helenes Property Place LLC. PACMLS as distributed by MLS GRID
- $369,0003 bd2 ba1.3k sqft1438 SW Lost Trail Dr, Pullman, WA 99163For SaleMLS ID #296978, Melanie Lange, Woodbridge Real Estate. PACMLS as distributed by MLS GRID
- $179,0002 bd2 ba1.2k sqft600 SW Crestview St, Pullman, WA 99163For SaleMLS ID #293942, Brian L Howard, Amplify Real Estate Services W. PACMLS as distributed by MLS GRID
- $135,0003 bd2 ba1.2k sqft206 NW Lancer Ln, Pullman, WA 99163For SaleMLS ID #295009, Robert Stout, Realty One Group Eclipse. PACMLS as distributed by MLS GRID
- $189,0002 bd2 ba920 sqft2005 NE Terre View Dr APT A5, Pullman, WA 99163For SaleMLS ID #294290, Chance Weil, Century 21 Price Right. PACMLS as distributed by MLS GRID
- $264,5003 bd1 ba1.5k sqft308 E Church St, Uniontown, WA 99179For SaleMLS ID #295078, Ashley Alred, Coldwell Banker Tomlinson Associates. PACMLS as distributed by MLS GRID
- $180,0002 bd2 ba920 sqft2005 NE Terre View Dr #A7-a-7, Pullman, WA 99163For SaleMLS ID #292788, Joe Pitzer, RE/MAX Home and Land. PACMLS as distributed by MLS GRID
- $254,9003 bd2 ba1.3k sqft3391 Morley Rd, Colfax, WA 99111For SaleMLS ID #296391, Magan Smith, LATAH REALTY, LLC. PACMLS as distributed by MLS GRID
