$229,000
10 bd|4 ba|2k sqft
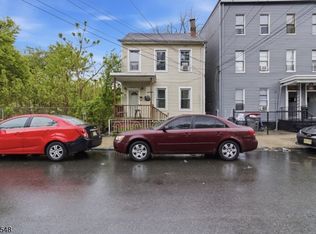
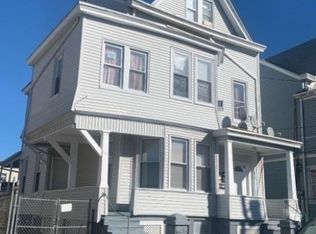
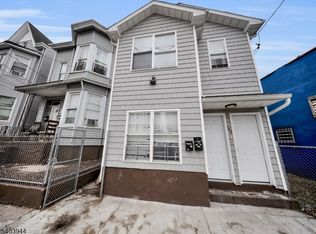
65 Arch St #67, Paterson, NJ 07522
Off Market
Zillow last checked:
Listing updated:
Juliane Lindor 516-557-7711,
United Real Estate,
Jose Gignoux
$626,000
$595,000 - $657,000
$2,124/mo
| Date | Event | Price |
|---|---|---|
| 4/7/2026 | Listed for sale | $626,000+71.5%$326/sqft |
Source: | ||
| 6/21/2022 | Sold | $365,000+87.2%$190/sqft |
Source: Public Record Report a problem | ||
| 12/1/2020 | Sold | $195,000+2.6%$102/sqft |
Source: | ||
| 11/3/2020 | Pending sale | $190,000$99/sqft |
Source: GOLD TEAM REALTY #3672248 Report a problem | ||
| 10/16/2020 | Listed for sale | $190,000-35.6%$99/sqft |
Source: GOLD TEAM REALTY #3672248 Report a problem | ||
| 1/30/2018 | Listing removed | -- |
Source: Hudson & Marshall Report a problem | ||
| 1/12/2018 | Listed for sale | -- |
Source: Hudson & Marshall Report a problem | ||
| 7/31/2009 | Sold | $295,000-39.4%$154/sqft |
Source: Public Record Report a problem | ||
| 4/24/2008 | Sold | $486,529+8.1%$253/sqft |
Source: Public Record Report a problem | ||
| 1/25/2007 | Sold | $450,000+59.6%$234/sqft |
Source: Public Record Report a problem | ||
| 5/11/2005 | Sold | $282,000+125.6%$147/sqft |
Source: Public Record Report a problem | ||
| 5/4/2001 | Sold | $125,000+40.4%$65/sqft |
Source: Public Record Report a problem | ||
| 3/8/2000 | Sold | $89,000+1347.2%$46/sqft |
Source: Public Record Report a problem | ||
| 4/23/1998 | Sold | $6,150$3/sqft |
Source: Public Record Report a problem | ||
| Year | Property taxes | Tax assessment |
|---|---|---|
| 2025 | $7,607 +3.9% | $149,300 |
| 2024 | $7,320 +1.8% | $149,300 |
| 2023 | $7,192 +7.6% | $149,300 |
| 2022 | $6,683 | $149,300 |
| 2021 | $6,683 +10.7% | $149,300 |
| 2020 | $6,036 -3% | $149,300 +2.3% |
| 2019 | $6,225 +4.9% | $146,000 +1.5% |
| 2018 | $5,936 -9.2% | $143,900 +0.8% |
| 2017 | $6,539 +5.6% | $142,700 -5.3% |
| 2016 | $6,191 -17.8% | $150,700 |
| 2015 | $7,528 +5.7% | $150,700 -41.9% |
| 2014 | $7,123 +9.1% | $259,600 |
| 2013 | $6,529 | $259,600 |
| 2012 | $6,529 +18.3% | $259,600 |
| 2011 | $5,519 +10.1% | $259,600 |
| 2010 | $5,013 | $259,600 |
| 2009 | -- | $259,600 |
| 2008 | -- | $259,600 |
| 2007 | -- | $259,600 +2157.4% |
| 2001 | -- | $11,500 |
Find assessor info on the county website
A local agent can set up tours, give advice and negotiate with sellers.