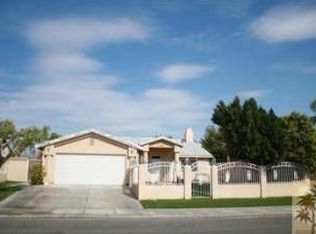
Tenant pays Electrical and gas, Owner pays for pool and gardening service
This property is off market, which means it's not currently listed for sale or rent on Zillow. This may be different from what's available on other websites or public sources.
$674,300
$641,000 - $708,000
$3,790/mo
$3,790/mo
Rent Zestimate®
Find your next renter with Zillow Rental Manager. Plus, with online applications, you can quickly screen prospective tenants – for free.
$3,790/mo
Rent Zestimate®
$4,287/mo
Est. payment
Refinancing to a lower rate could help reduce your monthly payments and save thousands over the life of the loan.
$4,287/mo
Est. payment
Work with a Zillow partner agent
Leverage their expertise and Zillow's premium Showcase listings to get your home seen by more buyers.
Get startedList with your own agent
Get your home in front of millions of buyers by listing it on Zillow.
Learn how to do itSell it yourself
Take full control of how buyers see your home on Zillow by listing For Sale by Owner (FSBO).
List your homeTenant pays Electrical and gas, Owner pays for pool and gardening service
This property is off market, which means it's not currently listed for sale or rent on Zillow. This may be different from what's available on other websites or public sources.
Zillow last checked:
Listing updated:
| Date | Event | Price |
|---|---|---|
| 3/16/2026 | Listing removed | $3,900$2/sqft |
Source: Zillow Rentals Report a problem | ||
| 2/18/2026 | Listed for rent | $3,900-1.3%$2/sqft |
Source: Zillow Rentals Report a problem | ||
| 2/18/2026 | Listing removed | $3,950$2/sqft |
Source: CRMLS #TR26009035 Report a problem | ||
| 1/22/2026 | Listed for rent | $3,950-6%$2/sqft |
Source: CRMLS #TR26009035 Report a problem | ||
| 1/21/2026 | Listing removed | $4,200$2/sqft |
Source: Zillow Rentals Report a problem | ||
| 1/16/2026 | Listed for rent | $4,200$2/sqft |
Source: Zillow Rentals Report a problem | ||
| 10/7/2021 | Listing removed | -- |
Source: | ||
| 10/7/2021 | Pending sale | $625,000+5.9%$280/sqft |
Source: | ||
| 10/6/2021 | Sold | $590,000-5.6%$264/sqft |
Source: | ||
| 9/7/2021 | Contingent | $625,000$280/sqft |
Source: | ||
| 8/20/2021 | Listed for sale | $625,000+76.1%$280/sqft |
Source: | ||
| 7/12/2019 | Sold | $355,000-7.8%$159/sqft |
Source: | ||
| 6/6/2019 | Pending sale | $385,000$172/sqft |
Source: Bennion Deville Homes #219014535 Report a problem | ||
| 5/24/2019 | Listed for sale | $385,000-14.3%$172/sqft |
Source: Bennion Deville Homes #219014535 Report a problem | ||
| 4/27/2005 | Sold | $449,000+69.8%$201/sqft |
Source: | ||
| 12/8/2003 | Sold | $264,500+468.8%$119/sqft |
Source: Public Record Report a problem | ||
| 12/6/2002 | Sold | $46,500$21/sqft |
Source: Public Record Report a problem | ||
| Year | Property taxes | Tax assessment |
|---|---|---|
| 2025 | $8,604 -0.5% | $626,112 +2% |
| 2024 | $8,643 -0.2% | $613,836 +2% |
| 2023 | $8,663 +2% | $601,800 +2% |
| 2022 | $8,495 +56.7% | $590,000 +64.5% |
| 2021 | $5,421 +10.1% | $358,677 +1% |
| 2020 | $4,925 -11.9% | $355,000 -11.8% |
| 2019 | $5,588 +3.3% | $402,480 +4% |
| 2018 | $5,409 +8.8% | $387,000 +9.9% |
| 2017 | $4,973 | $352,000 +2.9% |
| 2016 | $4,973 +7% | $342,000 +0.9% |
| 2015 | $4,649 +32.5% | $339,000 +39.5% |
| 2014 | $3,510 | $243,000 +7.5% |
| 2013 | -- | $226,000 -0.9% |
| 2012 | -- | $228,000 +3.2% |
| 2011 | -- | $221,000 -7.1% |
| 2010 | -- | $238,000 -3.6% |
| 2009 | -- | $247,000 -39.5% |
| 2008 | -- | $408,000 -12.7% |
| 2007 | -- | $467,138 +2% |
| 2006 | -- | $457,980 +69.8% |
| 2005 | -- | $269,789 |
Find assessor info on the county website