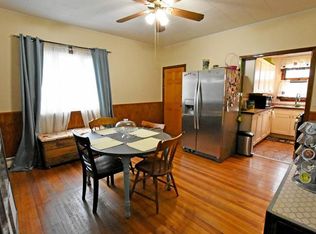
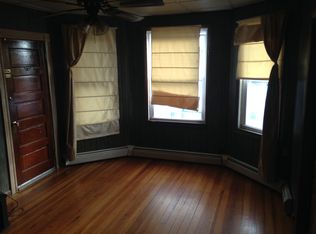
OVER 3000 SQUARE FEET LARGE INVESTMENT HOME NEAR THE OCEAN WITH PARKING AND MOVE IN READY. Lots of updates over the years. This is a turnkey investment or a perfect owner occupant on the outskirts of the city with a lovely large backyard, and parking which is huge plus in Fall River, View of the OCEAN. Off-street parking, with 3 finished levels, basement nice and high for future expansion with, all separate utilities. Buy this home and your tenant will help you pay your mortgage/expenses. This one is in close proximity to lots of area amenities and easy access to expressway.
Sold for $700,000
$700,000
684 Penn St, Fall River, MA 02724
9beds
3,177sqft
3 Family
Built in 1900
-- sqft lot
$762,700 Zestimate®
$220/sqft
$1,582 Estimated rent
Home value
$762,700
$694,000 - $839,000
$1,582/mo
Zestimate® history
Owner options
List your home for rent
$1,582/mo
Rent Zestimate®
Find your next renter with Zillow Rental Manager. Plus, with online applications, you can quickly screen prospective tenants – for free.
$1,582/mo
Rent Zestimate®
Refinance and save
$4,302/mo
Est. payment
Refinancing to a lower rate could help reduce your monthly payments and save thousands over the life of the loan.
$4,302/mo
Est. payment
Explore your selling options
Work with a Zillow partner agent
Leverage their expertise and Zillow's premium Showcase listings to get your home seen by more buyers.
Get startedList with your own agent
Get your home in front of millions of buyers by listing it on Zillow.
Learn how to do itSell it yourself
Take full control of how buyers see your home on Zillow by listing For Sale by Owner (FSBO).
List your homeWhat's special
Zillow last checked:
Listing updated:
Listed by:
Mayra Andrade 774-381-8441,
Vicente Realty, LLC 508-944-3144
Bought with:
Adelino Vicente
Vicente Realty, LLC
Source: MLS PIN,MLS#: 73290354
Facts & features
Interior
Bedrooms & bathrooms
- Bedrooms: 9
- Bathrooms: 3
- Full bathrooms: 3
Features
- Basement: Full
- Has fireplace: No
Interior area
- Total structure area: 3,177
- Total interior livable area: 3,177 sqft
Property
Parking
- Total spaces: 4
- Uncovered spaces: 4
Features
- Fencing: Fenced/Enclosed
- Waterfront features: Waterfront, Ocean, Bay, 1 to 2 Mile To Beach
Lot
- Size: 5,001 sqft
Details
- Parcel number: M:0B09 B:0000 L:0009,2821036
- Zoning: R-4
Construction
Type & style
- Home type: MultiFamily
- Property subtype: 3 Family
Materials
- Foundation: Stone
Condition
- Year built: 1900
Utilities & green energy
- Sewer: Public Sewer
- Water: Public
Community & neighborhood
Location
- Region: Fall River
HOA & financial
Other financial information
- Total actual rent: 0
Price history
| Date | Event | Price |
|---|---|---|
| 11/27/2024 | Sold | $700,000-2.7%$220/sqft |
Source: MLS PIN #73290354 Report a problem | ||
| 9/15/2024 | Listed for sale | $719,777+19%$227/sqft |
Source: MLS PIN #73290354 Report a problem | ||
| 7/21/2022 | Sold | $605,000-4%$190/sqft |
Source: MLS PIN #72977994 Report a problem | ||
| 5/7/2022 | Listed for sale | $629,900+99.3%$198/sqft |
Source: MLS PIN #72977994 Report a problem | ||
| 7/9/2018 | Sold | $316,000+2%$99/sqft |
Source: Public Record Report a problem | ||
| 5/30/2018 | Pending sale | $309,900$98/sqft |
Source: RE/MAX RIVER'S EDGE #1188947 Report a problem | ||
| 5/21/2018 | Listed for sale | $309,900$98/sqft |
Source: RE/MAX River's Edge - Bristol #1188947 Report a problem | ||
| 5/20/2018 | Pending sale | $309,900$98/sqft |
Source: RE/MAX RIVER'S EDGE #1188947 Report a problem | ||
| 4/30/2018 | Listed for sale | $309,900+3.3%$98/sqft |
Source: RE/MAX River's Edge #72317363 Report a problem | ||
| 5/6/2011 | Listing removed | $299,900$94/sqft |
Source: NCI #71078590 Report a problem | ||
| 7/18/2010 | Price change | $299,900-7.7%$94/sqft |
Source: Kenneth A Mongeon #71078590 Report a problem | ||
| 5/12/2010 | Listed for sale | $324,900-6.9%$102/sqft |
Source: Kenneth A Mongeon #71078590 Report a problem | ||
| 3/8/2010 | Listing removed | $349,000$110/sqft |
Source: NCI #70991999 Report a problem | ||
| 10/28/2009 | Listed for sale | $349,000+179.2%$110/sqft |
Source: NCI #70991999 Report a problem | ||
| 5/3/2000 | Sold | $125,000+47.1%$39/sqft |
Source: Public Record Report a problem | ||
| 3/16/2000 | Sold | $85,000$27/sqft |
Source: Public Record Report a problem | ||
Public tax history
| Year | Property taxes | Tax assessment |
|---|---|---|
| 2025 | $6,142 +4.4% | $536,400 +4.7% |
| 2024 | $5,885 +1.3% | $512,200 +8.2% |
| 2023 | $5,811 +13.7% | $473,600 +17% |
| 2022 | $5,109 +6.6% | $404,800 +16.8% |
| 2021 | $4,792 +12.3% | $346,500 +17.3% |
| 2020 | $4,267 +25.9% | $295,300 +27.1% |
| 2019 | $3,388 +7.8% | $232,400 +8.1% |
| 2018 | $3,143 +3.7% | $215,000 -0.7% |
| 2017 | $3,032 +2.7% | $216,600 +0% |
| 2016 | $2,951 +5.7% | $216,500 +1.5% |
| 2015 | $2,791 -3.8% | $213,400 -7.4% |
| 2014 | $2,900 +3.6% | $230,500 -1.7% |
| 2013 | $2,799 +6.3% | $234,600 -2.2% |
| 2012 | $2,633 +5% | $239,800 -13.6% |
| 2010 | $2,508 +8.2% | $277,400 -3.5% |
| 2009 | $2,318 +5.2% | $287,600 +0.1% |
| 2008 | $2,204 +7.9% | $287,300 +1% |
| 2007 | $2,042 +9.7% | $284,400 +4.3% |
| 2006 | $1,862 -0.3% | $272,600 +11.1% |
| 2005 | $1,867 +14.3% | $245,400 +23.4% |
| 2004 | $1,633 +16.7% | $198,900 +52.3% |
| 2003 | $1,399 +8.9% | $130,600 |
| 2002 | $1,285 -5.9% | $130,600 +0.1% |
| 2000 | $1,365 +23.5% | $130,500 +8.4% |
| 1995 | $1,105 | $120,400 |
Find assessor info on the county website
Neighborhood: Sandy Beach
Nearby schools
GreatSchools rating
- 4/10Carlton M. Viveiros Elementary SchoolGrades: K-5Distance: 0.3 mi
- 2/10Matthew J Kuss Middle SchoolGrades: 6-8Distance: 0.7 mi
- 2/10B M C Durfee High SchoolGrades: 9-12Distance: 3.4 mi
Get a cash offer in 3 minutes
Find out how much your home could sell for in as little as 3 minutes with a no-obligation cash offer.
Estimated market value
$762,700
Get a cash offer in 3 minutes
Find out how much your home could sell for in as little as 3 minutes with a no-obligation cash offer.
Estimated market value
$762,700
Nearby cities
Nearby neighborhoods
Nearby zip codes
Other Fall River Topics
