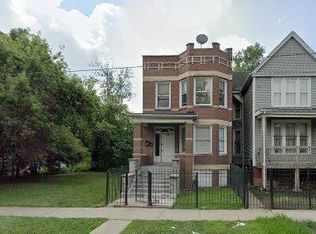
This 2-unit style single family home offers 4 bedrooms and 2 bathrooms with approximately 2246 square feet of living space on a 0.07acre lot. This is a cash or cash equivalent purchase only with no inspection or financing contingencies.
Auction
Price Unknown
6925 S Carpenter St, Chicago, IL 60621
4beds
--sqft
Multi Family
Built in 1930
-- sqft lot
$329,500 Zestimate®
$--/sqft
$-- HOA
What's special
- 13 days
- 85
- 6
Zillow last checked:
Listing updated:
Listed by:
Victor Gutierrez 773-447-8754,
Vylla Home
Source: MRED as distributed by MLS GRID,MLS#: 12797096
Facts & features
Interior
Bedrooms & bathrooms
- Bedrooms: 4
- Bathrooms: 2
- Full bathrooms: 2
Heating
- Has Heating (Unspecified Type)
Features
- Basement: Finished,Full,Walk-Out Access
Property
Parking
- Total spaces: 2
- Parking features: No Garage, Yes, Garage Owned, Detached, Garage
- Garage spaces: 2
Lot
- Size: 3,125 Square Feet
- Dimensions: 25' X 125'
- Features: Common Grounds
Details
- Parcel number: 20204190170000
- Zoning: MULTI
- Special conditions: None
Construction
Type & style
- Home type: MultiFamily
- Property subtype: Multi Family
Materials
- Brick
- Foundation: Concrete Perimeter
- Roof: Rubber
Condition
- New construction: No
- Year built: 1930
Utilities & green energy
- Sewer: Public Sewer
- Water: Lake Michigan
Community & HOA
Community
- Features: Park, Sidewalks, Street Lights, Street Paved
Location
- Region: Chicago
Financial & listing details
- Tax assessed value: $170,010
- Annual tax amount: $3,543
- Date on market: 10/29/2026
- Ownership: Fee Simple
Estimated market value
$329,500
$303,000 - $359,000
$1,736/mo
Price history
| Date | Event | Price |
|---|---|---|
| 10/30/2026 | Listed for sale | -- |
Source:  MRED as distributed by MLS GRID #12797096 Report a problem | ||
| 3/29/2023 | Sold | $251,000+0.6% |
Source: MRED as distributed by MLS GRID #11704270 Report a problem | ||
| 2/26/2023 | Contingent | $249,500 |
Source: MRED as distributed by MLS GRID #11704270 Report a problem | ||
| 2/20/2023 | Price change | $249,500-0.2% |
Source: MRED as distributed by MLS GRID #11704270 Report a problem | ||
| 2/13/2023 | Listed for sale | $249,900 |
Source: MRED as distributed by MLS GRID #11704270 Report a problem | ||
| 2/8/2023 | Contingent | $249,900 |
Source: MRED as distributed by MLS GRID #11704270 Report a problem | ||
| 1/20/2023 | Listed for sale | $249,900+56.3% |
Source: MRED as distributed by MLS GRID #11704270 Report a problem | ||
| 9/20/2021 | Listing removed | -- |
Source: MRED as distributed by MLS GRID #11123012 Report a problem | ||
| 6/15/2021 | Listed for sale | $159,900 |
Source: MRED as distributed by MLS GRID #11123012 Report a problem | ||
| 3/24/2021 | Listing removed | -- |
Source: Owner Report a problem | ||
| 3/12/2016 | Listing removed | $950 |
Source: Owner Report a problem | ||
| 12/29/2015 | Listed for rent | $950+18.8% |
Source: Owner Report a problem | ||
| 3/10/2015 | Listing removed | $800 |
Source: Owner Report a problem | ||
| 10/15/2014 | Listed for rent | $800 |
Source: Owner Report a problem | ||
Public tax history
| Year | Property taxes | Tax assessment |
|---|---|---|
| 2024 | $3,416 +156.8% | $17,001 +169.7% |
| 2023 | $1,330 +2.6% | $6,303 |
| 2022 | $1,296 -18.1% | $6,303 -19.9% |
| 2021 | $1,583 +23.8% | $7,871 +37.2% |
| 2020 | $1,278 -2.4% | $5,738 -12% |
| 2019 | $1,310 +1.7% | $6,521 |
| 2018 | $1,288 -66.5% | $6,521 -63.5% |
| 2017 | $3,842 +7.5% | $17,849 |
| 2016 | $3,575 +9.3% | $17,849 |
| 2015 | $3,271 +9% | $17,849 +10.3% |
| 2014 | $3,001 +2% | $16,175 |
| 2013 | $2,942 +1.4% | $16,175 |
| 2012 | $2,903 +5.6% | $16,175 -4.6% |
| 2011 | $2,748 -0.4% | $16,955 |
| 2010 | $2,759 +4.4% | $16,955 |
| 2009 | $2,644 +11.4% | $16,955 +2.5% |
| 2008 | $2,373 +1% | $16,542 |
| 2007 | $2,349 -1.1% | $16,542 |
| 2006 | $2,375 +42.7% | $16,542 +62.4% |
| 2005 | $1,664 +1% | $10,186 |
| 2004 | $1,648 +2.2% | $10,186 |
| 2003 | $1,612 +103.7% | $10,186 +131.3% |
| 2002 | $791 -28.2% | $4,404 |
| 2001 | $1,101 -11.6% | $4,404 -30.8% |
| 2000 | $1,246 -0.7% | $6,360 -2% |
| 1999 | $1,255 | $6,488 |
Find assessor info on the county website
Monthly payment
Est. payment
Payment breakdown
Explore the cost of this home by adjusting the details. Changes won't be saved.Climate risks
Neighborhood: Englewood
Nearby schools


Similar homes
- $--5 bd2 ba-- sqft6609 S Sangamon St, Chicago, IL 60621Auction
 MLS ID #12742800, Grazyna Przybysz, Chicago Area Realty Inc. MRED as distributed by MLS GRID
- $189,9004 bd2 ba2k sqft6730 S Sangamon St, Chicago, IL 60621Price Change
 MLS ID #12742360, Matthew Petersen, Bauvista Illinois LLC. MRED as distributed by MLS GRID
- $169,0005 bd2 ba-- sqft531 W 61st Pl, Chicago, IL 60621Active
 MLS ID #12767848, Dimitris Mellos, James Group Properties LLC. MRED as distributed by MLS GRID
- $--6 bd2 ba2.7k sqft7640 S Morgan St, Chicago, IL 60620Auction
 Auction.com 1
