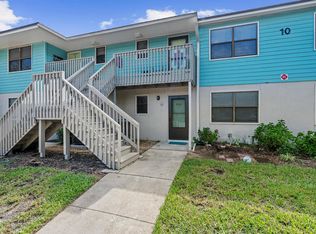
Location, lifestyle, and convenience come together in this ideally situated Anastasia Island condo! Enjoy the best of coastal living with beautiful St. Augustine beaches just a quick bike ride away and the charm of historic downtown just a short drive from your doorstep. Explore local restaurants, boutique shopping, historic landmarks, and all the attractions that make St. Augustine such a sought-after destination. Nestled within an established community featuring a swimming pool, this condo offers the perfect opportunity to embrace a relaxed, low-maintenance island lifestyle. Whether you’re searching for a primary residence or coastal getaway, this prime location puts the very best of St. Augustine within easy reach
For sale
$189,000
700 W Pope Rd Unit M97, Saint Augustine, FL 32080
2beds
757sqft
Condominium
Built in 1984
-- sqft lot
$-- Zestimate®
$250/sqft
$350/mo HOA
What's special
- 2 days
- 191
- 11
Likely to sell faster than
Zillow last checked:
Listing updated:
Listed by:
Virginia Louise Armstrong 904-671-5444,
MAXREV
Source: St Augustine St Johns County BOR,MLS#: 264842
Facts & features
Interior
Bedrooms & bathrooms
- Bedrooms: 2
- Bathrooms: 1
- Full bathrooms: 1
Primary bedroom
- Level: First
Interior area
- Total structure area: 757
- Total interior livable area: 757 sqft
Property
Features
- Stories: 1
- Entry location: Ground Level
- Has private pool: Yes
Details
- Parcel number: 1619810970
- Zoning: RG-2
Construction
Type & style
- Home type: Condo
- Property subtype: Condominium
Condition
- New construction: No
- Year built: 1984
Community & HOA
Community
- Subdivision: Coquina Lakes Condo
HOA
- Has HOA: Yes
- HOA fee: $350 monthly
Location
- Region: Saint Augustine
Financial & listing details
- Price per square foot: $250/sqft
- Tax assessed value: $147,000
- Annual tax amount: $1,988
- Price range: $189K - $189K
- Date on market: 11/8/2026
Estimated market value
Not available
Estimated sales range
Not available
Not available
Price history
| Date | Event | Price |
|---|---|---|
| 11/8/2026 | Listed for sale | $189,000-9.6%$250/sqft |
Source:  St Augustine St Johns County BOR #264842 Report a problem | ||
| 10/8/2026 | Listing removed | $209,000$276/sqft |
Source: St Augustine St Johns County BOR #261290 Report a problem | ||
| 7/18/2026 | Pending sale | $209,000$276/sqft |
Source: St Augustine St Johns County BOR #261290 Report a problem | ||
| 3/20/2026 | Listed for sale | $209,000-1.4%$276/sqft |
Source: St Augustine St Johns County BOR #261290 Report a problem | ||
| 1/13/2026 | Listing removed | $212,000$280/sqft |
Source: St Augustine St Johns County BOR #253502 Report a problem | ||
| 8/8/2025 | Price change | $212,000-2.3%$280/sqft |
Source: St Augustine St Johns County BOR #253502 Report a problem | ||
| 6/12/2025 | Listed for sale | $217,000+1%$287/sqft |
Source: St Augustine St Johns County BOR #253502 Report a problem | ||
| 6/4/2025 | Listing removed | $214,750$284/sqft |
Source: St Augustine St Johns County BOR #250028 Report a problem | ||
| 2/24/2025 | Price change | $214,750-2.3%$284/sqft |
Source: St Augustine St Johns County BOR #250028 Report a problem | ||
| 1/3/2025 | Listed for sale | $219,750-3.4%$290/sqft |
Source: St Augustine St Johns County BOR #250028 Report a problem | ||
| 8/30/2024 | Listing removed | $227,500$301/sqft |
Source: St Augustine St Johns County BOR #240202 Report a problem | ||
| 6/13/2024 | Price change | $227,500-4.2%$301/sqft |
Source: St Augustine St Johns County BOR #240202 Report a problem | ||
| 3/28/2024 | Listed for sale | $237,500+21.2%$314/sqft |
Source: St Augustine St Johns County BOR #240202 Report a problem | ||
| 8/29/2022 | Sold | $196,000-6.2%$259/sqft |
Source: Agent Provided Report a problem | ||
| 6/3/2022 | Sold | $209,000+5%$276/sqft |
Source:  realMLS #1173678 Report a problem | ||
| 5/6/2022 | Contingent | $199,000$263/sqft |
Source: St Augustine St Johns County BOR #223566 Report a problem | ||
| 5/3/2022 | Listed for sale | $199,000+0.5%$263/sqft |
Source: St Augustine St Johns County BOR #223566 Report a problem | ||
| 10/21/2021 | Sold | $198,000+126.5%$262/sqft |
Source: Agent Provided Report a problem | ||
| 11/7/2016 | Sold | $87,400-34.8%$115/sqft |
Source: Public Record Report a problem | ||
| 12/8/2005 | Sold | $134,000+97.1%$177/sqft |
Source: Public Record Report a problem | ||
| 10/2/2001 | Sold | $68,000$90/sqft |
Source: Public Record Report a problem | ||
Public tax history
| Year | Property taxes | Tax assessment |
|---|---|---|
| 2025 | $1,988 -7.2% | $147,000 -13.5% |
| 2024 | $2,142 -2.9% | $170,000 -1.7% |
| 2023 | $2,206 +440.4% | $172,980 +127.3% |
| 2022 | $408 +1.3% | $76,089 +3% |
| 2021 | $403 -0.1% | $73,873 +1.4% |
| 2020 | $404 -1.7% | $72,853 +2.3% |
| 2019 | $411 | $71,215 +1.9% |
| 2018 | $411 +0.1% | $69,887 +2.1% |
| 2017 | $410 | $68,450 +29.9% |
| 2016 | $410 -48.3% | $52,708 +12.1% |
| 2015 | $792 +25.3% | $47,000 +9.3% |
| 2014 | $632 | $43,000 +19.4% |
| 2013 | -- | $36,000 |
| 2012 | -- | $36,000 +2.1% |
| 2011 | -- | $35,250 -25% |
| 2010 | -- | $47,000 -24.8% |
| 2009 | -- | $62,500 -30.6% |
| 2008 | -- | $90,000 -16.3% |
| 2007 | -- | $107,500 |
| 2006 | -- | $107,500 |
| 2005 | -- | $107,500 +72% |
| 2004 | -- | $62,500 +11% |
| 2003 | -- | $56,320 +2.4% |
| 2002 | -- | $55,000 +55.1% |
| 2001 | -- | $35,463 +3% |
| 2000 | -- | $34,430 |
Find assessor info on the county website
Monthly payment
Est. payment
Payment breakdown
Explore the cost of this home by adjusting the details. Changes won't be saved.Climate risks
Neighborhood: 32080
- $149,0002 bd1 ba757 sqft700 W Pope Rd UNIT H57, Saint Augustine, FL 32080Sold

- $181,7502 bd1 ba757 sqft700 W Pope Rd UNIT D28, Saint Augustine, FL 32080Sold

- $175,0002 bd1 ba757 sqft700 W Pope Rd UNIT E38, Saint Augustine, FL 32080Sold

- $142,3292 bd1 ba757 sqft700 W Pope Rd UNIT I71, Saint Augustine, FL 32080Sold

Similar homes
- $189,9002 bd1 ba720 sqft650 W POPE Road #207, St. Augustine, FL 32080For Sale
 MLS ID #2165683, MARY E HIGGINBOTHAM. realMLS
- $169,0002 bd1 ba720 sqft650 W Pope Rd Unit 266, Saint Augustine, FL 32080For Sale
 MLS ID #264309, Kim Devlin, FIV Realty Co. St Augustine St Johns County BOR
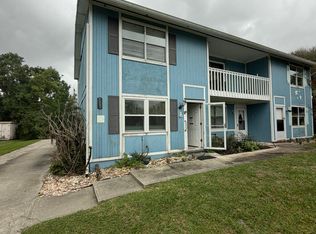
- $169,9002 bd2 ba800 sqft123 RIO DEL MAR Street #A, St. Augustine, FL 32080For Sale
 MLS ID #2172406, HANNAH SHEEHAN. realMLS
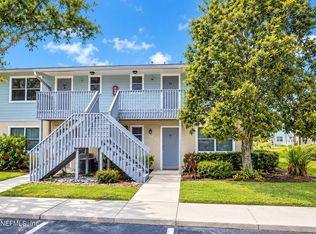
- $169,0002 bd1 ba757 sqft700 W POPE Road #G54, St. Augustine, FL 32080For Sale
 MLS ID #2168340, RICHARD DETTRA. realMLS
