Opportunity awaits you in this home! Main floor includes a living room, formal dining, sun room and open floored kitchen layout with main floor laundry and a full bathroom. Upstairs is 3 bedrooms and a potential 2nd bathroom space just ready for you to make your own! Outside includes a cement pad for off street parking.
Active
$40,000
707 S Starr Ave, Burlington, IA 52601
3beds
1,654sqft
Single Family Residence
Built in 1900
6,534 Square Feet Lot
$-- Zestimate®
$24/sqft
$-- HOA
What's special
Formal diningSun roomMain floor laundryOpen floored kitchen layout
- 7 days
- 345
- 28
Likely to sell faster than
Zillow last checked:
Listing updated:
Listed by:
Maddie Belknap 319-461-9057,
Century 21/Property Professionals
Source: NoCoast MLS as distributed by MLS GRID,MLS#: 6343670
Facts & features
Interior
Bedrooms & bathrooms
- Bedrooms: 3
- Bathrooms: 2
- Full bathrooms: 2
Heating
- Forced Air
Cooling
- Central Air
Features
- Basement: Stone/Rock,Unfinished
Interior area
- Total interior livable area: 1,654 sqft
Property
Parking
- Parking features: Paved
Accessibility
- Accessibility features: None
Features
- Levels: One and One Half
Lot
- Size: 6,534 Square Feet
- Dimensions: 50 x 119
Details
- Parcel number: 1606433004
Construction
Type & style
- Home type: SingleFamily
- Property subtype: Single Family Residence
Materials
- Slate
Condition
- Year built: 1900
Utilities & green energy
- Sewer: Public Sewer
- Water: Public
Community & HOA
Community
- Subdivision: LEEBRICK ADD
HOA
- Has HOA: No
Location
- Region: Burlington
Financial & listing details
- Price per square foot: $24/sqft
- Tax assessed value: $42,600
- Annual tax amount: $456
- Date on market: 10/13/2026
- Cumulative days on market: 7 days
Estimated market value
Not available
Estimated sales range
Not available
Not available
Price history
| Date | Event | Price |
|---|---|---|
| 10/13/2026 | Listed for sale | $40,000+5.3%$24/sqft |
Source:  NoCoast MLS as distributed by MLS GRID #6343670 Report a problem | ||
| 6/22/2026 | Sold | $38,000-5%$23/sqft |
Source: NoCoast MLS as distributed by MLS GRID #6337671 Report a problem | ||
| 5/19/2026 | Pending sale | $40,000$24/sqft |
Source: NoCoast MLS as distributed by MLS GRID #6337671 Report a problem | ||
| 4/27/2026 | Listed for sale | $40,000+122.2%$24/sqft |
Source: NoCoast MLS as distributed by MLS GRID #6337671 Report a problem | ||
| 4/29/2024 | Sold | $18,000-48.6%$11/sqft |
Source: Public Record Report a problem | ||
| 2/26/2021 | Listing removed | -- |
Source: Owner Report a problem | ||
| 1/26/2019 | Listing removed | $35,000$21/sqft |
Source: Owner Report a problem | ||
| 1/23/2019 | Price change | $35,000-22.2%$21/sqft |
Source: Owner Report a problem | ||
| 11/11/2018 | Price change | $45,000-25%$27/sqft |
Source: Owner Report a problem | ||
| 6/27/2018 | Listed for sale | $60,000$36/sqft |
Source: Owner Report a problem | ||
Public tax history
| Year | Property taxes | Tax assessment |
|---|---|---|
| 2025 | $456 +14.6% | $42,600 +81.3% |
| 2024 | $398 -7% | $23,500 |
| 2023 | $428 -56.8% | $23,500 +10.3% |
| 2022 | $990 -6.8% | $21,300 -56.2% |
| 2021 | $1,062 +0.8% | $48,600 |
| 2020 | $1,054 +1% | $48,600 |
| 2019 | $1,044 -0.2% | $48,600 +7% |
| 2018 | $1,046 | $45,400 +3.7% |
| 2017 | $1,046 +4.8% | $43,800 |
| 2016 | $998 | $43,800 |
| 2015 | $998 -1.2% | $43,800 -5.2% |
| 2014 | $1,010 -1.5% | $46,200 |
| 2013 | $1,025 +2.4% | -- |
| 2012 | $1,001 +5.8% | -- |
| 2011 | $946 +0.9% | -- |
| 2010 | $938 +7.3% | -- |
| 2009 | $874 +5.6% | -- |
| 2008 | $828 +5.1% | -- |
| 2007 | $788 | -- |
Find assessor info on the county website
Monthly payment
Est. payment
Payment breakdown
Explore the cost of this home by adjusting the details. Changes won't be saved.Climate risks
Neighborhood: 52601

Similar homes
- $39,9003 bd1 ba1.2k sqft1104 S 10th St, Burlington, IA 52601Active
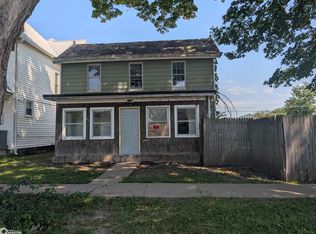 MLS ID #6342374, Cynthia K Miller, Century 21/Property Professionals. NoCoast MLS as distributed by MLS GRID
- $45,0004 bd2 ba2.3k sqft1107 N 7th St, Burlington, IA 52601Active
 MLS ID #6342471, Danielle Delzell-Cary, RE/MAX Real Estate Specialists. NoCoast MLS as distributed by MLS GRID
- $49,9003 bd1 ba1.2k sqft432 May Ave, Burlington, IA 52601Active
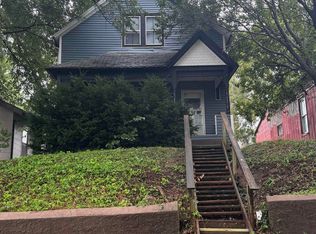 MLS ID #6342953, Maddie Belknap, Century 21/Property Professionals. NoCoast MLS as distributed by MLS GRID
- $43,4003 bd1 ba1k sqft258 S 10th St, Burlington, IA 52601Active - Contingent
 MLS ID #6338635, Kristin E Masden, Diamond Realty Inc. NoCoast MLS as distributed by MLS GRID
