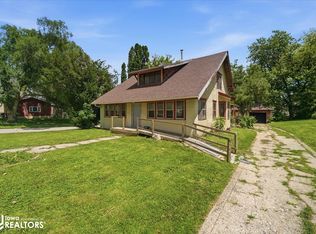
This very solid home is an excellent opportunity for fix & flip, rental, or make it your own. It is partially demoed inside, and pretty primitive, but solid bones, excellent block foundation and clean, dry basement. Huge upside potential with this one. Call or text today!
Active - contingent
$16,500
709 Franklin St, Ackley, IA 50601
3beds
2,184sqft
Single Family Residence
Built in 1915
0.39 Acres Lot
$-- Zestimate®
$8/sqft
$-- HOA
What's special
Clean dry basementSolid bones
- 26 days
- 658
- 45
Likely to sell faster than
Zillow last checked:
Listing updated:
Listed by:
Dave Wiges 712-263-4694,
McCord Insurance & Real Estate
Source: NoCoast MLS as distributed by MLS GRID,MLS#: 6343084
Facts & features
Interior
Bedrooms & bathrooms
- Bedrooms: 3
- Bathrooms: 2
- Full bathrooms: 1
- 3/4 bathrooms: 1
Heating
- Forced Air
Cooling
- Central Air
Features
- Basement: Full,Daylight,Block
Interior area
- Total interior livable area: 2,184 sqft
- Finished area above ground: 1,456
- Finished area below ground: 728
Property
Parking
- Parking features: Gravel
Accessibility
- Accessibility features: None
Features
- Levels: Two
Lot
- Size: 0.39 Acres
- Dimensions: 140 x 120
Details
- Parcel number: 891902404006
Construction
Type & style
- Home type: SingleFamily
- Property subtype: Single Family Residence
Materials
- Vinyl Siding
Condition
- Year built: 1915
Utilities & green energy
- Sewer: Public Sewer
- Water: Public
Community & HOA
HOA
- Has HOA: No
Location
- Region: Ackley
Financial & listing details
- Price per square foot: $8/sqft
- Tax assessed value: $22,730
- Annual tax amount: $394
- Date on market: 9/25/2026
- Cumulative days on market: 27 days
Estimated market value
Not available
Estimated sales range
Not available
Not available
Price history
| Date | Event | Price |
|---|---|---|
| 9/25/2026 | Listed for sale | $16,500+2900%$8/sqft |
Source:  NoCoast MLS as distributed by MLS GRID #6343084 Report a problem | ||
| 9/21/2026 | Sold | $550-97.5% |
Source: Public Record Report a problem | ||
| 6/10/2016 | Sold | $22,000-21.1%$10/sqft |
Source: NoCoast MLS as distributed by MLS GRID #5340329 Report a problem | ||
| 4/22/2016 | Price change | $27,900-3.5%$13/sqft |
Source: Staley Real Estate #15031 Report a problem | ||
| 4/4/2016 | Price change | $28,900-3.3%$13/sqft |
Source: Staley Real Estate #15031 Report a problem | ||
| 2/1/2016 | Price change | $29,900-40.1%$14/sqft |
Source: Staley Real Estate #15031 Report a problem | ||
| 12/18/2015 | Listed for sale | $49,900+10.9%$23/sqft |
Source: Owner Report a problem | ||
| 3/15/2013 | Listing removed | $45,000$21/sqft |
Source: Jennings Real Estate #13703 Report a problem | ||
| 1/2/2013 | Price change | $45,000-24.9%$21/sqft |
Source: Jennings Real Estate #13703 Report a problem | ||
| 10/3/2012 | Listed for sale | $59,900+100.3%$27/sqft |
Source: Jennings Real Estate #13703 Report a problem | ||
| 1/3/2012 | Sold | $29,900-16.7%$14/sqft |
Source: NoCoast MLS as distributed by MLS GRID #5338954 Report a problem | ||
| 4/25/2011 | Listing removed | $35,900$16/sqft |
Source: Jennings Real Estate #12821 Report a problem | ||
| 4/8/2011 | Price change | $35,900-10%$16/sqft |
Source: Jennings Real Estate #12821 Report a problem | ||
| 2/9/2011 | Listed for sale | $39,900$18/sqft |
Source: Listhub #12821 Report a problem | ||
Public tax history
| Year | Property taxes | Tax assessment |
|---|---|---|
| 2025 | $414 -10.4% | $22,730 -10.8% |
| 2024 | $462 -4.1% | $25,490 |
| 2023 | $482 +4.3% | $25,490 +14.9% |
| 2022 | $462 -33.4% | $22,190 |
| 2021 | $694 +3.3% | $22,190 -28.4% |
| 2020 | $672 +0.6% | $30,990 |
| 2019 | $668 +8.7% | $30,990 |
| 2018 | $614 -6.4% | $30,990 +10% |
| 2017 | $656 +4.8% | $28,180 |
| 2016 | $626 -5.2% | $28,180 |
| 2015 | $660 +1.5% | $28,180 |
| 2014 | $650 +13.2% | $28,180 |
| 2013 | $574 +67.8% | -- |
| 2012 | $342 -37.8% | -- |
| 2010 | $550 -20.1% | -- |
| 2007 | $688 | -- |
Find assessor info on the county website
Monthly payment
Est. payment